

Delaware at-large
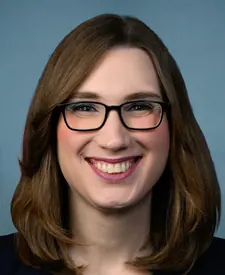
Tue, Nov 3 · Seat held by Sarah McBride Democratic since Jan 2025
No published poll names both candidates.Last result · 2024 general: Sarah McBride (D) 57.9, John J. Whalen III (R) 42.1
- Last election
- Sarah McBride (Democratic) won by 15.8 points, 2024
- Margin since 2022
- 3.3 points toward Democrats
- On the 2026 ballot
- 2 candidates
Side by side
Left column: ArminioRight column: McBride
- Total receipts, 2025-2026 cycle, through Oct 14
- $12K
- $5.6M
- Cash on hand
- $7K
- $2.3M
- Donor-based spectrum
- LiberalCentristConservativeMcBrideNo published score for Arminio
- Races
- None listed
- Won 3 of 3
- Years since first win
- Not available
- 1
- Age on Election Day
- Not available
- 36
Money: FEC bulk data, through Oct 14. One or more are matched to the FEC by name, party and seat, so a total could belong to someone else.
How these are counted
Total receipts line of each candidate’s principal campaign committee, 2025-2026 cycle, filed through Sep 30 and Oct 14. Other sites may show career, six-year or all-committee totals, which differ. Arminio: $12,302 received, $6,944 cash on hand. McBride: $5,556,755 received, $2,326,039 cash on hand. The spectrum is a published research score, not our rating. How this works. Wins and losses count the races in our results files, the same as each profile.
More about this race
Candidates on the ballot
- Sarah McBrideIncumbentDemocratic
- Joseph "Dr. Joe" ArminioRepublican
Source: elections.delaware.gov, dated Oct 28
Shift since 2022: 3.3 points toward Democrats (Democratic by 12.5 in 2022, Democratic by 15.8 in 2024).
All Delaware districts
- D 15+ pts
- D 5 to 15 pts
- D under 5 pts
- R under 5 pts
- R 5 to 15 pts
- R 15+ pts
- Other winner
- No data
Show these districts as a list (1)
- Delaware at-large· Sarah McBride (D), Democratic by 15.8 points, 2024
Map settings
Vote in Delaware
Trouble voting? Election Protection hotline: 866-OUR-VOTE. A nonpartisan coalition of civil-rights and voting-rights groups, not a government service. 866ourvote.org
History (25 elections for this seat)
- Votes for listed candidates
- 497,436
- Election day
- November 5, 2024
- District map
- Same as today
US House, Delaware at-large, 2024, every candidate Candidate Party Votes and share Share DemocraticSarah McBrideWon Democratic 287,83057.9% RepublicanJohn J. Whalen III Republican 209,60642.1% - Votes for listed candidates
- 321,649
- Election day
- November 8, 2022
- District map
- Same as today
US House, Delaware at-large, 2022, every candidate Candidate Party Votes and share Share DemocraticLisa Blunt RochesterWon Democratic 178,41655.5% RepublicanLee Murphy Republican 138,20143.0% LibertarianCody McNutt Libertarian 3,0741.0% NonpartisanDavid Rogers Other 1,9580.6% - Votes for listed candidates
- 488,270
- Election day
- November 3, 2020
- District map
- Older district map (2012 to 2020)
US House, Delaware at-large, 2020, every candidate Candidate Party Votes and share Share DemocraticLisa Blunt RochesterWon Democratic 281,38257.6% RepublicanLee Murphy Republican 196,39240.2% OtherCatherine S Purcell Other 6,6821.4% LibertarianDavid L Rogers Libertarian 3,8140.8% - Votes for listed candidates
- 352,737
- Election day
- November 6, 2018
- District map
- Older district map (2012 to 2020)
US House, Delaware at-large, 2018, every candidate Candidate Party Votes and share Share DemocraticLisa Blunt RochesterWon Democratic 227,35364.5% RepublicanScott Walker Republican 125,38435.5% - Votes for listed candidates
- 420,617
- Election day
- November 8, 2016
- District map
- Older district map (2012 to 2020)
US House, Delaware at-large, 2016, every candidate Candidate Party Votes and share Share DemocraticLisa Blunt RochesterWon Democratic 233,55455.5% RepublicanHans Reigle Republican 172,30141.0% GreenMark J Perri Green 8,3262.0% LibertarianScott A Gesty Libertarian 6,4361.5% - Votes for listed candidates
- 231,617
- Election day
- November 4, 2014
- District map
- Older district map (2012 to 2020)
US House, Delaware at-large, 2014, every candidate Candidate Party Votes and share Share DemocraticJohn C Carney JrWon Democratic 137,25159.3% RepublicanRose Izzo Republican 85,14636.8% GreenBernard August Green 4,8012.1% LibertarianScott Gesty Libertarian 4,4191.9% - Votes for listed candidates
- 388,059
- Election day
- November 6, 2012
- District map
- Older district map (2012 to 2020)
US House, Delaware at-large, 2012, every candidate Candidate Party Votes and share Share DemocraticJohn C CarneyWon Democratic 249,93364.4% RepublicanThomas H Kovach Republican 129,75733.4% GreenBernard August Green 4,2731.1% LibertarianScott Gesty Libertarian 4,0961.1% - Votes for listed candidates
- 305,636
- Election day
- November 2, 2010
- District map
- Older district map (2002 to 2010)
US House, Delaware at-large, 2010, every candidate Candidate Party Votes and share Share DemocraticJohn C CarneyWon Democratic 173,54356.8% RepublicanGlen Urquhart Republican 125,44241.0% OtherEarl R Lofland Other 3,7041.2% LibertarianBrent A Wangen Libertarian 1,9860.6% OtherJeffrey Brown Other 9610.3% - Votes for listed candidates
- 385,457
- Election day
- November 4, 2008
- District map
- Older district map (2002 to 2010)
US House, Delaware at-large, 2008, every candidate Candidate Party Votes and share Share RepublicanMichael N CastleWon Republican 235,43761.1% DemocraticKaren Hartley-Nagle Democratic 146,43438.0% LibertarianMark Anthony Parks Libertarian 3,5860.9% - Votes for listed candidates
- 251,694
- Election day
- November 7, 2006
- District map
- Older district map (2002 to 2010)
US House, Delaware at-large, 2006, every candidate Candidate Party Votes and share Share RepublicanMichael N CastleWon Republican 143,89757.2% DemocraticDennis Spivack Democratic 97,56538.8% IndependentKaren M Hartley-Nagle Independent 5,7692.3% GreenMichael Berg Green 4,4631.8% - Votes for listed candidates
- 356,045
- Election day
- November 2, 2004
- District map
- Older district map (2002 to 2010)
US House, Delaware at-large, 2004, every candidate Candidate Party Votes and share Share RepublicanMichael N CastleWon Republican 245,97869.1% DemocraticPaul Donnelly Democratic 105,71629.7% Scattered write-insName as filed: Writein Write-in 2,3370.7% LibertarianWilliam E Morris Libertarian 2,0140.6% - Votes for listed candidates
- 228,405
- Election day
- November 5, 2002
- District map
- Older district map (2002 to 2010)
US House, Delaware at-large, 2002, every candidate Candidate Party Votes and share Share RepublicanMichael N CastleWon Republican 164,60572.1% DemocraticMicheal C Miller Democratic 61,01126.7% LibertarianBrad C Thomas Libertarian 2,7891.2% - Votes for listed candidates
- 313,126
- Election day
- November 7, 2000
- District map
- Older district map (1992 to 2000)
US House, Delaware at-large, 2000, every candidate Candidate Party Votes and share Share RepublicanMichael N CastleWon Republican 211,79767.6% DemocraticMicheal C Miller Democratic 96,48830.8% OtherJames P Webster Other 2,4900.8% LibertarianBrad C Thomas Libertarian 2,3510.8% - Votes for listed candidates
- 180,529
- Election day
- November 3, 1998
- District map
- Older district map (1992 to 2000)
US House, Delaware at-large, 1998, every candidate Candidate Party Votes and share Share RepublicanMichael N CastleWon Republican 119,81166.4% DemocraticDennis E Williams Democratic 57,44631.8% OtherJames P Webster Other 2,4111.3% OtherKim Stanley Bemis Other 8590.5% OtherOther Other 20.0% - Votes for listed candidates
- 266,831
- Election day
- November 5, 1996
- District map
- Older district map (1992 to 2000)
US House, Delaware at-large, 1996, every candidate Candidate Party Votes and share Share RepublicanMichael N CastleWon Republican 185,57769.5% DemocraticDennis E Williams Democratic 73,25827.5% LibertarianGeorge A Jurgensen Libertarian 4,0001.5% OtherFelicia B Johnson Other 3,0091.1% OtherRobert E "Bob" Mattson Other 9870.4% - Votes for listed candidates
- 195,008
- Election day
- November 8, 1994
- District map
- Older district map (1992 to 2000)
US House, Delaware at-large, 1994, every candidate Candidate Party Votes and share Share RepublicanMichael N CastleWon Republican 137,94570.7% DemocraticCarol Ann DeSantis Democratic 51,79326.6% LibertarianDanny Ray Beaver Libertarian 3,8662.0% OtherDonald M Hockmuth Other 1,4040.7% - Votes for listed candidates
- 276,124
- Election day
- November 3, 1992
- District map
- Older district map (1992 to 2000)
US House, Delaware at-large, 1992, every candidate Candidate Party Votes and share Share RepublicanMichael N CastleWon Republican 153,03755.4% DemocraticS B Woo Democratic 117,42642.5% LibertarianPeggy Schmitt Libertarian 5,6612.1% - Votes for listed candidates
- 177,435
- Election day
- November 6, 1990
- District map
- Older district map (1982 to 1990)
US House, Delaware at-large, 1990, every candidate Candidate Party Votes and share Share DemocraticThomas R CarperWon Democratic 116,27465.5% RepublicanRalph O Williams Republican 58,03732.7% LibertarianRichard A Cohen Libertarian 3,1211.8% Scattered write-insName as filed: Writein Write-in 30.0% - Votes for listed candidates
- 234,517
- Election day
- November 8, 1988
- District map
- Older district map (1982 to 1990)
US House, Delaware at-large, 1988, every candidate Candidate Party Votes and share Share DemocraticThomas R CarperWon Democratic 158,33867.5% RepublicanJames P Krapf Republican 76,17932.5% - Votes for listed candidates
- 160,757
- Election day
- November 4, 1986
- District map
- Older district map (1982 to 1990)
US House, Delaware at-large, 1986, every candidate Candidate Party Votes and share Share DemocraticThomas R CarperWon Democratic 106,35166.2% RepublicanThomas S Neuberger Republican 53,76733.4% OtherPatrick F Harrison Other 6390.4% - Votes for listed candidates
- 243,014
- Election day
- November 6, 1984
- District map
- Older district map (1982 to 1990)
US House, Delaware at-large, 1984, every candidate Candidate Party Votes and share Share DemocraticThomas R CarperWon Democratic 142,07058.5% RepublicanElise Du Pont Republican 100,65041.4% LibertarianV Luther Etzel Libertarian 2940.1% - Votes for listed candidates
- 188,064
- Election day
- November 2, 1982
- District map
- Older district map (1982 to 1990)
US House, Delaware at-large, 1982, every candidate Candidate Party Votes and share Share DemocraticThomas R CarperWon Democratic 98,53352.4% RepublicanThomas B Evans Jr Republican 87,15346.3% OtherMary D Gies Other 1,1090.6% LibertarianRichard A Cohen Libertarian 7110.4% OtherDavid A Nuttall Other 5580.3% - Votes for listed candidates
- 216,575
- Election day
- November 4, 1980
- District map
- Older district map (1972 to 1980)
US House, Delaware at-large, 1980, every candidate Candidate Party Votes and share Share RepublicanThomas B Evans JrWon Republican 133,84261.8% DemocraticRobert L Maxwell Democratic 81,22737.5% LibertarianLawrence D Sullivan Libertarian 1,5060.7% - Votes for listed candidates
- 157,566
- Election day
- November 7, 1978
- District map
- Older district map (1972 to 1980)
US House, Delaware at-large, 1978, every candidate Candidate Party Votes and share Share RepublicanThomas B Evans JrWon Republican 91,68958.2% DemocraticGary E Hindes Democratic 64,86341.2% OtherJames E Hicks Other 1,0140.6% - Votes for listed candidates
- 215,085
- Election day
- November 2, 1976
- District map
- Older district map (1972 to 1980)
US House, Delaware at-large, 1976, every candidate Candidate Party Votes and share Share RepublicanThomas B Evans JrWon Republican 110,63651.4% DemocraticSamuel L Shipley Democratic 102,41147.6% OtherRobert G Lopresti Other 8400.4% OtherRaymond R Green Other 6930.3% OtherJoseph B Hollon Sr Other 3470.2% OtherPhilip Valenti Other 1580.1%
1976 to 2024: MIT Election Data and Science Lab, U.S. House 1976-2024, retrieved Oct 28, 2026. Compiled by MIT Election Data and Science Lab (MEDSL) from official returns; not an official source
District numbers are reused after each redistricting, so rows on older lines cover different territory than today's Delaware at-large.
Download and cite
Cite this page
Election Wrld. (2026). Delaware at-large, US House results. https://www.electionwrld.com/de/congress/at-large. Retrieved October 30, 2026.
Embed this seat
<iframe src="https://www.electionwrld.com/embed/de/congress/at-large" title="Delaware at-large, US House" width="100%" height="400" style="border:0;max-width:640px" loading="lazy"></iframe>
<p style="font-size:13px">Data: <a href="https://www.electionwrld.com">Election Wrld</a>, CC BY 4.0</p>Sources
Sources: MIT Election Data and Science Lab, U.S. House 1976-2024 (CC0 1.0), retrieved Oct 28, 2026, compiled by MIT Election Data and Science Lab (MEDSL) from official returns, not an official source; Census TIGERweb Legislative MapServer (120th CDs layer 0, 119th CDs layer 4, 2026 SLD upper layer 1 and lower layer 2) (US Census Bureau, public domain), retrieved Oct 28, 2026; unitedstates/congress-legislators (current) (CC0-1.0), retrieved Oct 28, 2026, compiled by the @unitedstates project volunteers (rosters from official congressional sources) from official returns, not an official source.
DataState data (JSON)Sources: MIT Election Data and Science Lab, U.S. House 1976-2024, FEC, DIME (ODC-BY), Portraits: unitedstates/images (public domain)Data as of Oct 28, 2026