

Illinois District 10
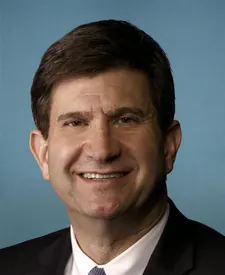
Tue, Nov 3 · Seat held by Bradley Scott Schneider Democratic since Jan 2017
No published poll names both candidates.Last result · 2024 general: Bradley Scott Schneider (D) 59.9, Jim Carris (R) 40.0
- Last election
- Bradley Scott Schneider (Democratic) won by 19.9 points, 2024
- Margin since 2022
- 6.1 points toward Republicans
- On the 2026 ballot
- 2 candidates
Side by side
Left column: LambrechtRight column: Schneider
- Total receipts, 2025-2026 cycle, through Oct 14
- No FEC report
- $3.7M
- Cash on hand
- No FEC report
- $1.7M
- Donor-based spectrum
- LiberalCentristConservativeSchneiderNo published score for Lambrecht
- Races
- None listed
- Won 6 of 7
- Years since first win
- Not available
- 13
- Age on Election Day
- Not available
- 65
Money: FEC bulk data, through Oct 14. One or more are matched to the FEC by name, party and seat, so a total could belong to someone else.
How these are counted
Total receipts line of each candidate’s principal campaign committee, 2025-2026 cycle. Other sites may show career, six-year or all-committee totals, which differ. Schneider: $3,657,882 received, $1,707,158 cash on hand. The spectrum is a published research score, not our rating. How this works. Wins and losses count the races in our results files, the same as each profile.
More about this race
Candidates on the ballot
- Bradley Scott SchneiderIncumbentDemocratic
- Carl LambrechtRepublican
Party nominees only, not the certified ballot.
Source: elections.il.gov, dated Oct 28
Shift since 2022: 6.1 points toward Republicans (Democratic by 26.0 in 2022, Democratic by 19.9 in 2024).
All Illinois districts
- D 15+ pts
- D 5 to 15 pts
- D under 5 pts
- R under 5 pts
- R 5 to 15 pts
- R 15+ pts
- Other winner
- No data
Show these districts as a list (17)
- Illinois District 1· Jonathan L. Jackson (D), Democratic by 31.7 points, 2024
- Illinois District 2· Robin L. Kelly (D), Democratic by 35.1 points, 2024
- Illinois District 3· Delia C. Ramirez (D), Democratic by 34.6 points, 2024
- Illinois District 4· Jesús G. "Chuy" García (D), Democratic by 40.2 points, 2024
- Illinois District 5· Mike Quigley (D), Democratic by 38.0 points, 2024
- Illinois District 6· Sean Casten (D), Democratic by 8.4 points, 2024
- Illinois District 7· Danny K. Davis (D), Democratic by 66.6 points, 2024
- Illinois District 8· Raja Krishnamoorthi (D), Democratic by 14.2 points, 2024
- Illinois District 9· Janice D. Schakowsky (D), Democratic by 36.8 points, 2024
- Illinois District 10· Bradley Scott Schneider (D), Democratic by 19.9 points, 2024
- Illinois District 11· Bill Foster (D), Democratic by 11.2 points, 2024
- Illinois District 12· Mike Bost (R), Republican by 48.4 points, 2024
- Illinois District 13· Nikki Budzinski (D), Democratic by 16.2 points, 2024
- Illinois District 14· Lauren Underwood (D), Democratic by 10.2 points, 2024
- Illinois District 15· Mary E. Miller (R), Republican by 99.0 points, 2024
- Illinois District 16· Darin LaHood (R), Republican by 99.8 points, 2024
- Illinois District 17· Eric Sorensen (D), Democratic by 8.8 points, 2024
Map settings
Vote in Illinois
Trouble voting? Election Protection hotline: 866-OUR-VOTE. A nonpartisan coalition of civil-rights and voting-rights groups, not a government service. 866ourvote.org
History (25 elections for this seat)
- Votes for listed candidates
- 327,621
- Election day
- November 5, 2024
- District map
- Same as today
US House, Illinois District 10, 2024, every candidate Candidate Party Votes and share Share DemocraticBradley Scott SchneiderWon Democratic 196,35859.9% RepublicanJim Carris Republican 131,02540.0% OtherJoseph Severino Other 2380.1% - Votes for listed candidates
- 242,165
- Election day
- November 8, 2022
- District map
- Same as today
US House, Illinois District 10, 2022, every candidate Candidate Party Votes and share Share DemocraticBradley Scott SchneiderWon Democratic 152,56663.0% RepublicanJoseph Severino Republican 89,59937.0% - Votes for listed candidates
- 316,874
- Election day
- November 3, 2020
- District map
- Older district map (2012 to 2020)
US House, Illinois District 10, 2020, every candidate Candidate Party Votes and share Share DemocraticBradley Scott SchneiderWon Democratic 202,40263.9% RepublicanValerie Ramirez Mukherjee Republican 114,44236.1% Joseph W Kopsick Write-in 180.0% David Rych Write-in 120.0% - Votes for listed candidates
- 238,664
- Election day
- November 6, 2018
- District map
- Older district map (2012 to 2020)
US House, Illinois District 10, 2018, every candidate Candidate Party Votes and share Share DemocraticBradley Scott SchneiderWonName as filed: Brad Schneider Democratic 156,54065.6% RepublicanDouglas R Bennett Republican 82,12434.4% - Votes for listed candidates
- 285,996
- Election day
- November 8, 2016
- District map
- Older district map (2012 to 2020)
US House, Illinois District 10, 2016, every candidate Candidate Party Votes and share Share DemocraticBradley Scott SchneiderWonName as filed: Brad Schneider Democratic 150,43552.6% RepublicanRobert J Dold Republican 135,53547.4% Scattered write-insName as filed: Writein Write-in 260.0% - Votes for listed candidates
- 187,128
- Election day
- November 4, 2014
- District map
- Older district map (2012 to 2020)
US House, Illinois District 10, 2014, every candidate Candidate Party Votes and share Share RepublicanRobert DoldWon Republican 95,99251.3% DemocraticBradley S Schneider Democratic 91,13648.7% - Votes for listed candidates
- 264,454
- Election day
- November 6, 2012
- District map
- Older district map (2012 to 2020)
US House, Illinois District 10, 2012, every candidate Candidate Party Votes and share Share DemocraticBrad SchneiderWon Democratic 133,89050.6% RepublicanRobert J Dold Republican 130,56449.4% - Votes for listed candidates
- 215,232
- Election day
- November 2, 2010
- District map
- Older district map (2002 to 2010)
US House, Illinois District 10, 2010, every candidate Candidate Party Votes and share Share RepublicanRobert DoldWon Republican 109,94151.1% DemocraticDaniel J Seals Democratic 105,29048.9% OtherAuthor C Brumfield Other 10.0% - Votes for listed candidates
- 291,258
- Election day
- November 4, 2008
- District map
- Older district map (2002 to 2010)
US House, Illinois District 10, 2008, every candidate Candidate Party Votes and share Share RepublicanMark Steven KirkWon Republican 153,08252.6% DemocraticDaniel J Seals Democratic 138,17647.4% - Votes for listed candidates
- 202,208
- Election day
- November 7, 2006
- District map
- Older district map (2002 to 2010)
US House, Illinois District 10, 2006, every candidate Candidate Party Votes and share Share RepublicanMark Steven KirkWon Republican 107,92953.4% DemocraticDaniel J Seals Democratic 94,27846.6% Scattered write-insName as filed: Writein Write-in 10.0% - Votes for listed candidates
- 276,711
- Election day
- November 2, 2004
- District map
- Older district map (2002 to 2010)
US House, Illinois District 10, 2004, every candidate Candidate Party Votes and share Share RepublicanMark Steven KirkWon Republican 177,49364.1% DemocraticLee Goodman Democratic 99,21835.9% - Votes for listed candidates
- 186,911
- Election day
- November 5, 2002
- District map
- Older district map (2002 to 2010)
US House, Illinois District 10, 2002, every candidate Candidate Party Votes and share Share RepublicanMark Steven KirkWon Republican 128,61168.8% DemocraticHenry H "Hank" Perritt Jr Democratic 58,30031.2% - Votes for listed candidates
- 237,506
- Election day
- November 7, 2000
- District map
- Older district map (1992 to 2000)
US House, Illinois District 10, 2000, every candidate Candidate Party Votes and share Share RepublicanMark Steven KirkWon Republican 121,58251.2% DemocraticLauren Beth Gash Democratic 115,92448.8% - Votes for listed candidates
- 138,429
- Election day
- November 3, 1998
- District map
- Older district map (1992 to 2000)
US House, Illinois District 10, 1998, every candidate Candidate Party Votes and share Share RepublicanJohn Edward PorterWon Republican 138,429100.0% - Votes for listed candidates
- 210,773
- Election day
- November 5, 1996
- District map
- Older district map (1992 to 2000)
US House, Illinois District 10, 1996, every candidate Candidate Party Votes and share Share RepublicanJohn Edward PorterWon Republican 145,62669.1% DemocraticPhilip R Torf Democratic 65,14430.9% Scattered write-insName as filed: Writein Write-in 30.0% - Votes for listed candidates
- 153,075
- Election day
- November 8, 1994
- District map
- Older district map (1992 to 2000)
US House, Illinois District 10, 1994, every candidate Candidate Party Votes and share Share RepublicanJohn Edward PorterWon Republican 114,88475.1% DemocraticAndrew M Krupp Democratic 38,19124.9% - Votes for listed candidates
- 240,630
- Election day
- November 3, 1992
- District map
- Older district map (1992 to 2000)
US House, Illinois District 10, 1992, every candidate Candidate Party Votes and share Share RepublicanJohn Edward PorterWon Republican 155,23064.5% DemocraticMichael J Kennedy Democratic 85,40035.5% - Votes for listed candidates
- 153,599
- Election day
- November 6, 1990
- District map
- Older district map (1982 to 1990)
US House, Illinois District 10, 1990, every candidate Candidate Party Votes and share Share RepublicanJohn Edward PorterWon Republican 104,07067.8% DemocraticPeg McNamara Democratic 47,28630.8% OtherHerbert L Gorrell Other 2,2431.5% - Votes for listed candidates
- 218,706
- Election day
- November 8, 1988
- District map
- Older district map (1982 to 1990)
US House, Illinois District 10, 1988, every candidate Candidate Party Votes and share Share RepublicanJohn Edward PorterWon Republican 158,51972.5% DemocraticEugene F Friedman Democratic 60,18727.5% - Votes for listed candidates
- 116,520
- Election day
- November 4, 1986
- District map
- Older district map (1982 to 1990)
US House, Illinois District 10, 1986, every candidate Candidate Party Votes and share Share RepublicanJohn E PorterWon Republican 87,53075.1% DemocraticRobert A Cleland Democratic 28,99024.9% - Votes for listed candidates
- 211,140
- Election day
- November 6, 1984
- District map
- Older district map (1982 to 1990)
US House, Illinois District 10, 1984, every candidate Candidate Party Votes and share Share RepublicanJohn E PorterWon Republican 153,33072.6% DemocraticRuth C Braver Democratic 57,80927.4% OtherOther Other 10.0% - Votes for listed candidates
- 153,868
- Election day
- November 2, 1982
- District map
- Older district map (1982 to 1990)
US House, Illinois District 10, 1982, every candidate Candidate Party Votes and share Share RepublicanJohn Edward PorterWon Republican 90,75059.0% DemocraticEugenia S Chapman Democratic 63,11541.0% Scattered write-insName as filed: Writein Write-in 30.0% - Votes for listed candidates
- 226,733
- Election day
- November 4, 1980
- District map
- Older district map (1972 to 1980)
US House, Illinois District 10, 1980, every candidate Candidate Party Votes and share Share RepublicanJohn Edward PorterWon Republican 137,70760.7% DemocraticRobert A Weinberger Democratic 89,00839.3% Scattered write-insName as filed: Writein Write-in 180.0% - Votes for listed candidates
- 178,309
- Election day
- November 7, 1978
- District map
- Older district map (1972 to 1980)
US House, Illinois District 10, 1978, every candidate Candidate Party Votes and share Share DemocraticAbner J MikvaWon Democratic 89,47950.2% RepublicanJohn E Porter Republican 88,82949.8% Scattered write-insName as filed: Writein Write-in 10.0% - Votes for listed candidates
- 213,414
- Election day
- November 2, 1976
- District map
- Older district map (1972 to 1980)
US House, Illinois District 10, 1976, every candidate Candidate Party Votes and share Share DemocraticAbner J MikvaWon Democratic 106,80450.0% RepublicanSamuel H Young Republican 106,60350.0% Scattered write-insName as filed: Writein Write-in 70.0%
1976 to 2024: MIT Election Data and Science Lab, U.S. House 1976-2024, retrieved Oct 28, 2026. Compiled by MIT Election Data and Science Lab (MEDSL) from official returns; not an official source
District numbers are reused after each redistricting, so rows on older lines cover different territory than today's Illinois District 10.
Download and cite
Cite this page
Election Wrld. (2026). Illinois District 10, US House results. https://www.electionwrld.com/il/congress/10. Retrieved October 30, 2026.
Embed this seat
<iframe src="https://www.electionwrld.com/embed/il/congress/10" title="Illinois District 10, US House" width="100%" height="400" style="border:0;max-width:640px" loading="lazy"></iframe>
<p style="font-size:13px">Data: <a href="https://www.electionwrld.com">Election Wrld</a>, CC BY 4.0</p>Sources
Sources: MIT Election Data and Science Lab, U.S. House 1976-2024 (CC0 1.0), retrieved Oct 28, 2026, compiled by MIT Election Data and Science Lab (MEDSL) from official returns, not an official source; Census TIGERweb Legislative MapServer (120th CDs layer 0, 119th CDs layer 4, 2026 SLD upper layer 1 and lower layer 2) (US Census Bureau, public domain), retrieved Oct 28, 2026; unitedstates/congress-legislators (current) (CC0-1.0), retrieved Oct 28, 2026, compiled by the @unitedstates project volunteers (rosters from official congressional sources) from official returns, not an official source.
DataState data (JSON)Sources: MIT Election Data and Science Lab, U.S. House 1976-2024, FEC, DIME (ODC-BY), Portraits: unitedstates/images (public domain)Data as of Oct 28, 2026