

Indiana District 7
Tue, Nov 3 · Seat held by André Carson Democratic since Mar 2008
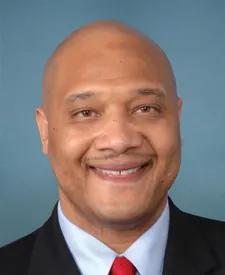
No published poll names both candidates.Last result · 2024 general: André Carson (D) 68.3, John P. Schmitz (R) 29.0, Rusty Johnson (L) 2.7
Show all 3 candidates on the ballot
- André CarsonIncumbentDemocratic
- Patrick McAuleyRepublican
- James M SceniakLibertarian
Showing major-party nominees, incumbents and candidates with 5%+ in the latest poll or comparable fundraising.
- Last election
- André Carson (Democratic) won by 39.3 points, 2024
- Margin since 2022
- 2.9 points toward Democrats
- On the 2026 ballot
- 3 candidates
Side by side
Left column: CarsonRight column: McAuley
- Total receipts, 2025-2026 cycle, through Oct 14
- $1.1M
- No FEC report
- Cash on hand
- $559K
- No FEC report
- Donor-based spectrum
- LiberalCentristConservativeCarsonNo published score for McAuley
- Races
- Won 9 of 9
- None listed
- Years since first win
- 18
- Not available
- Age on Election Day
- 52
- Not available
Money: FEC bulk data, through Oct 14. One or more are matched to the FEC by name, party and seat, so a total could belong to someone else.
How these are counted
Total receipts line of each candidate’s principal campaign committee, 2025-2026 cycle. Other sites may show career, six-year or all-committee totals, which differ. Carson: $1,131,715 received, $558,520 cash on hand. The spectrum is a published research score, not our rating. How this works. Wins and losses count the races in our results files, the same as each profile.
More about this race
Candidates on the ballot
- André CarsonIncumbentDemocratic
- Patrick McAuleyRepublican
- James M SceniakLibertarian
Source: in.gov (XLSX), dated Sep 22
Shift since 2022: 2.9 points toward Democrats (Democratic by 36.4 in 2022, Democratic by 39.3 in 2024).
All Indiana districts
- D 15+ pts
- D 5 to 15 pts
- D under 5 pts
- R under 5 pts
- R 5 to 15 pts
- R 15+ pts
- Other winner
- No data
Show these districts as a list (9)
- Indiana District 1· Frank J. Mrvan (D), Democratic by 8.5 points, 2024
- Indiana District 2· Rudy Yakym III (R), Republican by 28.1 points, 2024
- Indiana District 3· Marlin A. Stutzman (R), Republican by 33.6 points, 2024
- Indiana District 4· James R. Baird (R), Republican by 33.9 points, 2024
- Indiana District 5· Victoria Spartz (R), Republican by 18.6 points, 2024
- Indiana District 6· Jefferson Shreve (R), Republican by 32.2 points, 2024
- Indiana District 7· André Carson (D), Democratic by 39.3 points, 2024
- Indiana District 8· Mark B. Messmer (R), Republican by 38.5 points, 2024
- Indiana District 9· Erin Houchin (R), Republican by 31.7 points, 2024
Map settings
Vote in Indiana
Trouble voting? Election Protection hotline: 866-OUR-VOTE. A nonpartisan coalition of civil-rights and voting-rights groups, not a government service. 866ourvote.org
History (25 elections for this seat)
- Votes for listed candidates
- 272,148
- Election day
- November 5, 2024
- District map
- Same as today
US House, Indiana District 7, 2024, every candidate Candidate Party Votes and share Share DemocraticAndré CarsonWon Democratic 185,98768.3% RepublicanJohn P. Schmitz Republican 78,79229.0% LibertarianRusty Johnson Libertarian 7,3692.7% - Votes for listed candidates
- 175,180
- Election day
- November 8, 2022
- District map
- Same as today
US House, Indiana District 7, 2022, every candidate Candidate Party Votes and share Share DemocraticAndré CarsonWon Democratic 117,30967.0% RepublicanAngela Grabovsky Republican 53,63130.6% LibertarianGavin Maple Libertarian 4,2402.4% - Votes for listed candidates
- 282,568
- Election day
- November 3, 2020
- District map
- Older district map (2012 to 2020)
US House, Indiana District 7, 2020, every candidate Candidate Party Votes and share Share DemocraticAndré CarsonWon Democratic 176,42262.4% RepublicanSusan Marie Smith Republican 106,14637.6% - Votes for listed candidates
- 217,596
- Election day
- November 6, 2018
- District map
- Older district map (2012 to 2020)
US House, Indiana District 7, 2018, every candidate Candidate Party Votes and share Share DemocraticAndré CarsonWon Democratic 141,13964.9% RepublicanWayne "Gunny" Harmon Republican 76,45735.1% - Votes for listed candidates
- 264,670
- Election day
- November 8, 2016
- District map
- Older district map (2012 to 2020)
US House, Indiana District 7, 2016, every candidate Candidate Party Votes and share Share DemocraticAndré CarsonWon Democratic 158,73960.0% RepublicanCatherine "Cat" Ping Republican 94,45635.7% LibertarianDrew Thompson Libertarian 11,4754.3% - Votes for listed candidates
- 112,261
- Election day
- November 4, 2014
- District map
- Older district map (2012 to 2020)
US House, Indiana District 7, 2014, every candidate Candidate Party Votes and share Share DemocraticAndré CarsonWon Democratic 61,44354.7% RepublicanCatherine "Cat" Ping Republican 46,88741.8% LibertarianChris Mayo Libertarian 3,9313.5% - Votes for listed candidates
- 257,950
- Election day
- November 6, 2012
- District map
- Older district map (2012 to 2020)
US House, Indiana District 7, 2012, every candidate Candidate Party Votes and share Share DemocraticAndré CarsonWon Democratic 162,12262.9% RepublicanCarlos A May Republican 95,82837.1% - Votes for listed candidates
- 146,039
- Election day
- November 2, 2010
- District map
- Older district map (2002 to 2010)
US House, Indiana District 7, 2010, every candidate Candidate Party Votes and share Share DemocraticAndré CarsonWon Democratic 86,01158.9% RepublicanMarvin B Scott Republican 55,21337.8% LibertarianDav Wilson Libertarian 4,8153.3% - Votes for listed candidates
- 265,299
- Election day
- November 4, 2008
- District map
- Older district map (2002 to 2010)
US House, Indiana District 7, 2008, every candidate Candidate Party Votes and share Share DemocraticAndré CarsonWon Democratic 172,65065.1% RepublicanGabrielle Campo Republican 92,64534.9% Scattered write-insName as filed: Writein Write-in 40.0% - Votes for listed candidates
- 139,054
- Election day
- November 7, 2006
- District map
- Older district map (2002 to 2010)
US House, Indiana District 7, 2006, every candidate Candidate Party Votes and share Share DemocraticJulia CarsonWon Democratic 74,75053.8% RepublicanEric Dickerson Republican 64,30446.2% - Votes for listed candidates
- 223,175
- Election day
- November 2, 2004
- District map
- Older district map (2002 to 2010)
US House, Indiana District 7, 2004, every candidate Candidate Party Votes and share Share DemocraticJulia CarsonWon Democratic 121,30354.4% RepublicanAndrew "Andy" Horning Republican 97,49143.7% LibertarianBarry Campbell Libertarian 4,3812.0% - Votes for listed candidates
- 145,840
- Election day
- November 5, 2002
- District map
- Older district map (2002 to 2010)
US House, Indiana District 7, 2002, every candidate Candidate Party Votes and share Share DemocraticJulia M CarsonWon Democratic 77,47853.1% RepublicanBrose A McVey Republican 64,37944.1% LibertarianAndrew M Horning Libertarian 3,9192.7% Scattered write-insName as filed: Writein Write-in 640.0% - Votes for listed candidates
- 209,665
- Election day
- November 7, 2000
- District map
- Older district map (1992 to 2000)
US House, Indiana District 7, 2000, every candidate Candidate Party Votes and share Share RepublicanBrian D KernsWon Republican 135,86964.8% DemocraticMichael Douglas Graf Democratic 66,76431.8% LibertarianBob Thayer Libertarian 7,0323.4% - Votes for listed candidates
- 159,314
- Election day
- November 3, 1998
- District map
- Older district map (1992 to 2000)
US House, Indiana District 7, 1998, every candidate Candidate Party Votes and share Share RepublicanEdward A PeaseWon Republican 109,71268.9% DemocraticSamuel "Dutch" Hillenburg Democratic 44,82328.1% LibertarianBarbara Bourland Libertarian 4,7793.0% - Votes for listed candidates
- 209,840
- Election day
- November 5, 1996
- District map
- Older district map (1992 to 2000)
US House, Indiana District 7, 1996, every candidate Candidate Party Votes and share Share RepublicanEdward A PeaseWon Republican 130,01062.0% DemocraticRobert F Hellmann Democratic 72,70534.6% LibertarianBarbara Bourland Libertarian 7,1253.4% - Votes for listed candidates
- 160,300
- Election day
- November 8, 1994
- District map
- Older district map (1992 to 2000)
US House, Indiana District 7, 1994, every candidate Candidate Party Votes and share Share RepublicanJohn T MyersWon Republican 104,35965.1% DemocraticMichael M Harmless Democratic 55,94134.9% - Votes for listed candidates
- 217,194
- Election day
- November 3, 1992
- District map
- Older district map (1992 to 2000)
US House, Indiana District 7, 1992, every candidate Candidate Party Votes and share Share RepublicanJohn T MyersWon Republican 129,18959.5% DemocraticEllen E Wedum Democratic 88,00540.5% - Votes for listed candidates
- 153,846
- Election day
- November 6, 1990
- District map
- Older district map (1982 to 1990)
US House, Indiana District 7, 1990, every candidate Candidate Party Votes and share Share RepublicanJohn T MyersWon Republican 88,59857.6% DemocraticJohn Wm Riley Sr Democratic 65,24842.4% - Votes for listed candidates
- 211,316
- Election day
- November 8, 1988
- District map
- Older district map (1982 to 1990)
US House, Indiana District 7, 1988, every candidate Candidate Party Votes and share Share RepublicanJohn T MyersWon Republican 130,57861.8% DemocraticMark Richard Waterfill Democratic 80,73838.2% - Votes for listed candidates
- 157,163
- Election day
- November 4, 1986
- District map
- Older district map (1982 to 1990)
US House, Indiana District 7, 1986, every candidate Candidate Party Votes and share Share RepublicanJohn T MyersWon Republican 104,96566.8% DemocraticL Eugene Smith Democratic 49,67531.6% LibertarianBarbara J Bourland Libertarian 2,5231.6% - Votes for listed candidates
- 219,694
- Election day
- November 6, 1984
- District map
- Older district map (1982 to 1990)
US House, Indiana District 7, 1984, every candidate Candidate Party Votes and share Share RepublicanJohn T MyersWon Republican 147,78767.3% DemocraticArthur E Smith Democratic 69,09731.5% LibertarianBarbara L J Bourland Libertarian 2,8101.3% - Votes for listed candidates
- 186,133
- Election day
- November 2, 1982
- District map
- Older district map (1982 to 1990)
US House, Indiana District 7, 1982, every candidate Candidate Party Votes and share Share RepublicanJohn T MyersWon Republican 115,88462.3% DemocraticStephen S Bonney Democratic 70,24937.7% - Votes for listed candidates
- 208,264
- Election day
- November 4, 1980
- District map
- Older district map (1972 to 1980)
US House, Indiana District 7, 1980, every candidate Candidate Party Votes and share Share RepublicanJohn T MyersWon Republican 137,60466.1% DemocraticPatrick D Carroll Democratic 69,05133.2% IndependentPeter P Tescione Independent 1,6090.8% - Votes for listed candidates
- 154,424
- Election day
- November 7, 1978
- District map
- Older district map (1972 to 1980)
US House, Indiana District 7, 1978, every candidate Candidate Party Votes and share Share RepublicanJohn T MyersWon Republican 86,95556.3% DemocraticCharlotte T Zietlow Democratic 67,46943.7% - Votes for listed candidates
- 207,360
- Election day
- November 2, 1976
- District map
- Older district map (1972 to 1980)
US House, Indiana District 7, 1976, every candidate Candidate Party Votes and share Share RepublicanJohn T MyersWon Republican 130,00562.7% DemocraticJohn E Tipton Democratic 77,35537.3%
1976 to 2024: MIT Election Data and Science Lab, U.S. House 1976-2024, retrieved Oct 28, 2026. Compiled by MIT Election Data and Science Lab (MEDSL) from official returns; not an official source
District numbers are reused after each redistricting, so rows on older lines cover different territory than today's Indiana District 7.
Download and cite
Cite this page
Election Wrld. (2026). Indiana District 7, US House results. https://www.electionwrld.com/in/congress/7. Retrieved October 30, 2026.
Embed this seat
<iframe src="https://www.electionwrld.com/embed/in/congress/7" title="Indiana District 7, US House" width="100%" height="400" style="border:0;max-width:640px" loading="lazy"></iframe>
<p style="font-size:13px">Data: <a href="https://www.electionwrld.com">Election Wrld</a>, CC BY 4.0</p>Sources
Sources: MIT Election Data and Science Lab, U.S. House 1976-2024 (CC0 1.0), retrieved Oct 28, 2026, compiled by MIT Election Data and Science Lab (MEDSL) from official returns, not an official source; Census TIGERweb Legislative MapServer (120th CDs layer 0, 119th CDs layer 4, 2026 SLD upper layer 1 and lower layer 2) (US Census Bureau, public domain), retrieved Oct 28, 2026; unitedstates/congress-legislators (current) (CC0-1.0), retrieved Oct 28, 2026, compiled by the @unitedstates project volunteers (rosters from official congressional sources) from official returns, not an official source.
DataState data (JSON)Sources: MIT Election Data and Science Lab, U.S. House 1976-2024, FEC, DIME (ODC-BY), Portraits: unitedstates/images (public domain)Data as of Oct 28, 2026