

Maryland District 6
Tue, Nov 3 · Seat held by April McClain Delaney Democratic since Jan 2025
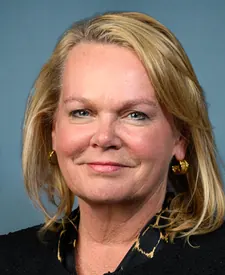
No published poll names both candidates.Last result · 2024 general: April McClain Delaney (D) 53.0, Neil C. Parrott (R) 46.7
Show all 3 candidates on the ballot
- April McClain DelaneyIncumbentDemocratic
- Robin FickerRepublican
- Moshe Y. LandmanGreen
Showing major-party nominees, incumbents and candidates with 5%+ in the latest poll or comparable fundraising.
- Last election
- April McClain Delaney (Democratic) won by 6.3 points, 2024
- Margin since 2022
- 3.2 points toward Republicans
- On the 2026 ballot
- 3 candidates
Side by side
Left column: DelaneyRight column: Ficker
- Total receipts, 2025-2026 cycle, through Oct 14
- $12.5M
- $1.3M
- Cash on hand
- $122K
- $4K
- Donor-based spectrum
- LiberalCentristConservativeDelaneyFicker
- Races
- Won 1 of 1
- None listed
- Years since first win
- 1
- Not available
- Age on Election Day
- 62
- Not available
Money: FEC bulk data, through Oct 14. One or more are matched to the FEC by name, party and seat, so a total could belong to someone else.
How these are counted
Total receipts line of each candidate’s principal campaign committee, 2025-2026 cycle. Other sites may show career, six-year or all-committee totals, which differ. Delaney: $12,535,128 received, $121,839 cash on hand. Ficker: $1,284,599 received, $4,328 cash on hand. The spectrum is a published research score, not our rating. How this works. Wins and losses count the races in our results files, the same as each profile.
More about this race
Candidates on the ballot
- April McClain DelaneyIncumbentDemocratic
- Robin FickerRepublican
- Moshe Y. LandmanGreen
Source: elections.maryland.gov, dated Oct 16
Shift since 2022: 3.2 points toward Republicans (Democratic by 9.5 in 2022, Democratic by 6.3 in 2024).
All Maryland districts
- D 15+ pts
- D 5 to 15 pts
- D under 5 pts
- R under 5 pts
- R 5 to 15 pts
- R 15+ pts
- Other winner
- No data
Show these districts as a list (8)
- Maryland District 1· Andy Harris (R), Republican by 22.0 points, 2024
- Maryland District 2· Johnny Olszewski, Jr. (D), Democratic by 18.7 points, 2024
- Maryland District 3· Sarah Elfreth (D), Democratic by 21.4 points, 2024
- Maryland District 4· Glenn Ivey (D), Democratic by 77.2 points, 2024
- Maryland District 5· Steny H. Hoyer (D), Democratic by 35.8 points, 2024
- Maryland District 6· April McClain Delaney (D), Democratic by 6.3 points, 2024
- Maryland District 7· Kweisi Mfume (D), Democratic by 63.1 points, 2024
- Maryland District 8· Jamie Raskin (D), Democratic by 56.3 points, 2024
Map settings
Vote in Maryland
- Register
- Registration, polling place, sample ballot lookup, mail ballot status
- ID rules
- Election office
Trouble voting? Election Protection hotline: 866-OUR-VOTE. A nonpartisan coalition of civil-rights and voting-rights groups, not a government service. 866ourvote.org
Maryland State Board of Elections
History (25 elections for this seat)
- Votes for listed candidates
- 376,624
- Election day
- November 5, 2024
- District map
- Same as today
US House, Maryland District 6, 2024, every candidate Candidate Party Votes and share Share DemocraticApril McClain DelaneyWon Democratic 199,78853.0% RepublicanNeil C. Parrott Republican 175,97446.7% OtherOther Write-Ins Other 8620.2% - Votes for listed candidates
- 256,398
- Election day
- November 8, 2022
- District map
- Same as today
US House, Maryland District 6, 2022, every candidate Candidate Party Votes and share Share DemocraticDavid J TroneWon Democratic 140,29554.7% RepublicanNeil C. Parrott Republican 115,77145.2% OtherOther Write-Ins Other 3320.1% - Votes for listed candidates
- 366,434
- Election day
- November 3, 2020
- District map
- Older district map (2012 to 2020)
US House, Maryland District 6, 2020, every candidate Candidate Party Votes and share Share DemocraticDavid J TroneWon Democratic 215,54058.8% RepublicanNeil C. Parrott Republican 143,59939.2% GreenGeorge Gluck Green 6,8931.9% Scattered write-insName as filed: Writein Write-in 3560.1% OtherJason Herrick Other 460.0% - Votes for listed candidates
- 276,974
- Election day
- November 6, 2018
- District map
- Older district map (2012 to 2020)
US House, Maryland District 6, 2018, every candidate Candidate Party Votes and share Share DemocraticDavid TroneWon Democratic 163,34659.0% RepublicanAmie Hoeber Republican 105,20938.0% LibertarianKevin T Caldwell Libertarian 4,9721.8% GreenGeorge Gluck Green 3,2751.2% Scattered write-insName as filed: Writein Write-in 1720.1% - Votes for listed candidates
- 331,973
- Election day
- November 8, 2016
- District map
- Older district map (2012 to 2020)
US House, Maryland District 6, 2016, every candidate Candidate Party Votes and share Share DemocraticJohn K DelaneyWon Democratic 185,77056.0% RepublicanAmie Hoeber Republican 133,08140.1% LibertarianDavid L Howser Libertarian 6,8892.1% GreenGeorge Gluck Green 5,8241.8% Scattered write-insName as filed: Writein Write-in 4090.1% - Votes for listed candidates
- 190,536
- Election day
- November 4, 2014
- District map
- Older district map (2012 to 2020)
US House, Maryland District 6, 2014, every candidate Candidate Party Votes and share Share DemocraticJohn K DelaneyWon Democratic 94,70449.7% RepublicanDan Bongino Republican 91,93048.2% GreenGeorge Gluck Green 3,7622.0% Scattered write-insName as filed: Writein Write-in 1400.1% - Votes for listed candidates
- 309,549
- Election day
- November 6, 2012
- District map
- Older district map (2012 to 2020)
US House, Maryland District 6, 2012, every candidate Candidate Party Votes and share Share DemocraticJohn DelaneyWon Democratic 181,92158.8% RepublicanRoscoe G Bartlett Republican 117,31337.9% LibertarianNickolaus Mueller Libertarian 9,9163.2% Scattered write-insName as filed: Writein Write-in 3990.1% - Votes for listed candidates
- 242,189
- Election day
- November 2, 2010
- District map
- Older district map (2002 to 2010)
US House, Maryland District 6, 2010, every candidate Candidate Party Votes and share Share RepublicanRoscoe G BartlettWon Republican 148,82061.4% DemocraticAndrew Duck Democratic 80,45533.2% LibertarianDan Massey Libertarian 6,8162.8% OtherMichael Reed Other 5,9072.4% Scattered write-insName as filed: Writein Write-in 1910.1% - Votes for listed candidates
- 330,535
- Election day
- November 4, 2008
- District map
- Older district map (2002 to 2010)
US House, Maryland District 6, 2008, every candidate Candidate Party Votes and share Share RepublicanRoscoe G BartlettWon Republican 190,92657.8% DemocraticJennifer P Dougherty Democratic 128,20738.8% LibertarianGary W Hoover Sr Libertarian 11,0603.3% Scattered write-insName as filed: Writein Write-in 3420.1% - Votes for listed candidates
- 239,453
- Election day
- November 7, 2006
- District map
- Older district map (2002 to 2010)
US House, Maryland District 6, 2006, every candidate Candidate Party Votes and share Share RepublicanRoscoe G BartlettWon Republican 141,20059.0% DemocraticAndrew Duck Democratic 92,03038.4% GreenRobert E Kozak Green 6,0952.5% Scattered write-insName as filed: Writein Write-in 1280.1% - Votes for listed candidates
- 305,508
- Election day
- November 2, 2004
- District map
- Older district map (2002 to 2010)
US House, Maryland District 6, 2004, every candidate Candidate Party Votes and share Share RepublicanRoscoe G BartlettWon Republican 206,07667.5% DemocraticKenneth T Bosley Democratic 90,10829.5% GreenGregory J Hemingway Green 9,3243.1% - Votes for listed candidates
- 223,400
- Election day
- November 5, 2002
- District map
- Older district map (2002 to 2010)
US House, Maryland District 6, 2002, every candidate Candidate Party Votes and share Share RepublicanRoscoe G BartlettWon Republican 147,82566.2% DemocraticDonald M Dearmon Democratic 75,57533.8% - Votes for listed candidates
- 278,045
- Election day
- November 7, 2000
- District map
- Older district map (1992 to 2000)
US House, Maryland District 6, 2000, every candidate Candidate Party Votes and share Share RepublicanRoscoe G BartlettWon Republican 168,62460.6% DemocraticDonald M Dearmon Democratic 109,13639.3% Scattered write-insName as filed: Writein Write-in 2030.1% GreenTim McCown Green 820.0% - Votes for listed candidates
- 201,530
- Election day
- November 3, 1998
- District map
- Older district map (1992 to 2000)
US House, Maryland District 6, 1998, every candidate Candidate Party Votes and share Share RepublicanRoscoe G BartlettWon Republican 127,80263.4% DemocraticTimothy D McCown Democratic 73,72836.6% - Votes for listed candidates
- 233,788
- Election day
- November 5, 1996
- District map
- Older district map (1992 to 2000)
US House, Maryland District 6, 1996, every candidate Candidate Party Votes and share Share RepublicanRoscoe G BartlettWon Republican 132,85356.8% DemocraticStephen Crawford Democratic 100,91043.2% Scattered write-insName as filed: Writein Write-in 250.0% - Votes for listed candidates
- 186,220
- Election day
- November 8, 1994
- District map
- Older district map (1992 to 2000)
US House, Maryland District 6, 1994, every candidate Candidate Party Votes and share Share RepublicanRoscoe G BartlettWon Republican 122,80965.9% DemocraticPaul Muldowney Democratic 63,41134.1% - Votes for listed candidates
- 231,788
- Election day
- November 3, 1992
- District map
- Older district map (1992 to 2000)
US House, Maryland District 6, 1992, every candidate Candidate Party Votes and share Share RepublicanRoscoe G BartlettWon Republican 125,56454.2% DemocraticThomas H Hattery Democratic 106,22445.8% - Votes for listed candidates
- 162,981
- Election day
- November 6, 1990
- District map
- Older district map (1982 to 1990)
US House, Maryland District 6, 1990, every candidate Candidate Party Votes and share Share DemocraticBeverly B ByronWon Democratic 106,50265.3% RepublicanChristopher P Fiotes Jr Republican 56,47934.7% - Votes for listed candidates
- 221,281
- Election day
- November 8, 1988
- District map
- Older district map (1982 to 1990)
US House, Maryland District 6, 1988, every candidate Candidate Party Votes and share Share DemocraticBeverly B ByronWon Democratic 166,75375.4% RepublicanKenneth W Halsey Republican 54,52824.6% - Votes for listed candidates
- 142,575
- Election day
- November 4, 1986
- District map
- Older district map (1982 to 1990)
US House, Maryland District 6, 1986, every candidate Candidate Party Votes and share Share DemocraticBeverly B ByronWon Democratic 102,97572.2% RepublicanJohn Vandenberge Republican 39,60027.8% - Votes for listed candidates
- 189,442
- Election day
- November 6, 1984
- District map
- Older district map (1982 to 1990)
US House, Maryland District 6, 1984, every candidate Candidate Party Votes and share Share DemocraticBeverly B ByronWon Democratic 123,38365.1% RepublicanRobin Ficker Republican 66,05634.9% OtherOther Other 30.0% - Votes for listed candidates
- 137,917
- Election day
- November 2, 1982
- District map
- Older district map (1982 to 1990)
US House, Maryland District 6, 1982, every candidate Candidate Party Votes and share Share DemocraticBeverly B ByronWon Democratic 102,59674.4% RepublicanRoscoe Bartlett Republican 35,32125.6% - Votes for listed candidates
- 209,014
- Election day
- November 4, 1980
- District map
- Older district map (1972 to 1980)
US House, Maryland District 6, 1980, every candidate Candidate Party Votes and share Share DemocraticBeverly B ByronWon Democratic 146,10169.9% RepublicanRaymond E Beck Republican 62,91330.1% - Votes for listed candidates
- 140,741
- Election day
- November 7, 1978
- District map
- Older district map (1972 to 1980)
US House, Maryland District 6, 1978, every candidate Candidate Party Votes and share Share DemocraticBeverly B ByronWon Democratic 126,19689.7% RepublicanMelvin Perkins Republican 14,54510.3% - Votes for listed candidates
- 179,004
- Election day
- November 2, 1976
- District map
- Older district map (1972 to 1980)
US House, Maryland District 6, 1976, every candidate Candidate Party Votes and share Share DemocraticGoodloe E ByronWon Democratic 126,80170.8% RepublicanArthur T Bond Republican 52,20329.2%
1976 to 2024: MIT Election Data and Science Lab, U.S. House 1976-2024, retrieved Oct 28, 2026. Compiled by MIT Election Data and Science Lab (MEDSL) from official returns; not an official source
District numbers are reused after each redistricting, so rows on older lines cover different territory than today's Maryland District 6.
Download and cite
Cite this page
Election Wrld. (2026). Maryland District 6, US House results. https://www.electionwrld.com/md/congress/6. Retrieved October 30, 2026.
Embed this seat
<iframe src="https://www.electionwrld.com/embed/md/congress/6" title="Maryland District 6, US House" width="100%" height="400" style="border:0;max-width:640px" loading="lazy"></iframe>
<p style="font-size:13px">Data: <a href="https://www.electionwrld.com">Election Wrld</a>, CC BY 4.0</p>Sources
Sources: MIT Election Data and Science Lab, U.S. House 1976-2024 (CC0 1.0), retrieved Oct 28, 2026, compiled by MIT Election Data and Science Lab (MEDSL) from official returns, not an official source; Census TIGERweb Legislative MapServer (120th CDs layer 0, 119th CDs layer 4, 2026 SLD upper layer 1 and lower layer 2) (US Census Bureau, public domain), retrieved Oct 28, 2026; unitedstates/congress-legislators (current) (CC0-1.0), retrieved Oct 28, 2026, compiled by the @unitedstates project volunteers (rosters from official congressional sources) from official returns, not an official source.
DataState data (JSON)Sources: MIT Election Data and Science Lab, U.S. House 1976-2024, FEC, DIME (ODC-BY), Portraits: unitedstates/images (public domain)Data as of Oct 28, 2026