

Michigan District 6
Tue, Nov 3 · Seat held by Debbie Dingell Democratic since Jan 2015
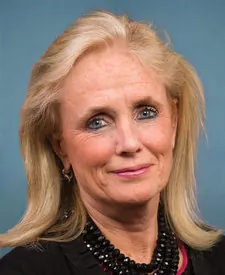
Debbie Dingell 62.0Heather Smiley 35.0
Last result · 2024 generalNo published poll names both candidates.
Show all 6 candidates on the ballot
- Debbie DingellIncumbentDemocratic
- Heather SmileyRepublican
- Timothy A. TeaganLibertarian
- Clyde ShabazzGreen
- Linda RayburnOther(Working Class Party)
- Mike MickeviciusOther(U.S. Taxpayers Party)
Showing major-party nominees, incumbents and candidates with 5%+ in the latest poll or comparable fundraising.
- Last election
- Debbie Dingell (Democratic) won by 27.0 points, 2024
- Margin since 2022
- 4.8 points toward Republicans
- On the 2026 ballot
- 6 candidates
Side by side
Left column: DingellRight column: Smiley
- Total receipts, 2025-2026 cycle, through Oct 14
- $1.5M
- No FEC report
- Cash on hand
- $456K
- No FEC report
- Donor-based spectrum
- LiberalCentristConservativeDingellSmiley
- Races won and lost
- 6-0
- 0-1
- Years since first win on file
- 11
- Not available
- Age on Election Day
- 72
- Not available
Money: FEC bulk data, through Oct 14. One or more are matched to the FEC by name, party and seat, so a total could belong to someone else.
How these are counted
Total receipts line of each candidate’s principal campaign committee, 2025-2026 cycle. Other sites may show career, six-year or all-committee totals, which differ. Dingell: $1,525,723 received, $455,811 cash on hand. The spectrum is a published research score, not our rating. How this works. Wins and losses count the races in our results files, the same as each profile.
More about this race
Candidates on the ballot
- Debbie DingellIncumbentDemocratic
- Heather SmileyRepublican
- Timothy A. TeaganLibertarian
- Clyde ShabazzGreen
- Linda RayburnOther(Working Class Party)
- Mike MickeviciusOther(U.S. Taxpayers Party)
Source: mi-boe.entellitrak.com, dated Oct 28
Shift since 2022: 4.8 points toward Republicans (Democratic by 31.8 in 2022, Democratic by 27.0 in 2024).
All Michigan districts
- D 15+ pts
- D 5 to 15 pts
- D under 5 pts
- R under 5 pts
- R 5 to 15 pts
- R 15+ pts
- Other winner
- No data
Show these districts as a list (13)
- Michigan District 1· Jack Bergman (R), Republican by 21.3 points, 2024
- Michigan District 2· John R. Moolenaar (R), Republican by 33.4 points, 2024
- Michigan District 3· Hillary J. Scholten (D), Democratic by 9.9 points, 2024
- Michigan District 4· Bill Huizenga (R), Republican by 11.7 points, 2024
- Michigan District 5· Tim Walberg (R), Republican by 32.9 points, 2024
- Michigan District 6· Debbie Dingell (D), Democratic by 27.0 points, 2024
- Michigan District 7· Tom Barrett (R), Republican by 3.7 points, 2024
- Michigan District 8· Kristen McDonald Rivet (D), Democratic by 6.7 points, 2024
- Michigan District 9· Lisa C. McClain (R), Republican by 37.3 points, 2024
- Michigan District 10· John James (R), Republican by 6.1 points, 2024
- Michigan District 11· Haley M. Stevens (D), Democratic by 18.6 points, 2024
- Michigan District 12· Rashida Tlaib (D), Democratic by 44.3 points, 2024
- Michigan District 13· Shri Thanedar (D), Democratic by 44.1 points, 2024
Map settings
Vote in Michigan
- Register
- Registration, polling place, mail ballot status
- Sample ballot lookup, election office
- ID rules
Trouble voting? Election Protection hotline: 866-OUR-VOTE. A nonpartisan coalition of civil-rights and voting-rights groups, not a government service. 866ourvote.org
History (25 elections for this seat)
- Votes for listed candidates
- 453,306
- Election day
- November 5, 2024
- District map
- Same as today
US House, Michigan District 6, 2024, every candidate Candidate Party Votes and share Share DemocraticDebbie DingellWon Democratic 281,16262.0% RepublicanHeather Smiley Republican 158,65835.0% GreenClyde K. Shabazz Green 7,9631.8% LibertarianBill Krebaum Libertarian 5,5231.2% - Votes for listed candidates
- 366,927
- Election day
- November 8, 2022
- District map
- Same as today
US House, Michigan District 6, 2022, every candidate Candidate Party Votes and share Share DemocraticDebbie DingellWon Democratic 241,75965.9% RepublicanWhittney Williams Republican 125,16734.1% OtherFrank Acosta Other 10.0% - Votes for listed candidates
- 378,980
- Election day
- November 3, 2020
- District map
- Older district map (2012 to 2020)
US House, Michigan District 6, 2020, every candidate Candidate Party Votes and share Share RepublicanFred UptonWon Republican 211,49655.8% DemocraticJon Hoadley Democratic 152,08540.1% LibertarianJeff Depoy Libertarian 10,3992.7% GreenJohn Lawrence Green 4,4401.2% Jerry Solis Write-in 5600.1% - Votes for listed candidates
- 293,438
- Election day
- November 6, 2018
- District map
- Older district map (2012 to 2020)
US House, Michigan District 6, 2018, every candidate Candidate Party Votes and share Share RepublicanFred UptonWon Republican 147,43650.2% DemocraticMatt Longjohn Democratic 134,08245.7% OtherStephen J Young Other 11,9204.1% - Votes for listed candidates
- 329,565
- Election day
- November 8, 2016
- District map
- Older district map (2012 to 2020)
US House, Michigan District 6, 2016, every candidate Candidate Party Votes and share Share RepublicanFred UptonWon Republican 193,25958.6% DemocraticPaul Clements Democratic 119,98036.4% LibertarianLorence Wenke Libertarian 16,2484.9% Scattered write-insName as filed: Writein Write-in 780.0% - Votes for listed candidates
- 208,976
- Election day
- November 4, 2014
- District map
- Older district map (2012 to 2020)
US House, Michigan District 6, 2014, every candidate Candidate Party Votes and share Share RepublicanFred UptonWon Republican 116,80155.9% DemocraticPaul Clements Democratic 84,39140.4% LibertarianErwin J Haas Libertarian 5,5302.6% GreenJohn M Lawrence Green 2,2541.1% - Votes for listed candidates
- 320,475
- Election day
- November 6, 2012
- District map
- Older district map (2012 to 2020)
US House, Michigan District 6, 2012, every candidate Candidate Party Votes and share Share RepublicanFred UptonWon Republican 174,95554.6% DemocraticMike O'Brien Democratic 136,56342.6% LibertarianChristie Gelineau Libertarian 6,3662.0% OtherJason Gatties Other 2,5910.8% - Votes for listed candidates
- 198,696
- Election day
- November 2, 2010
- District map
- Older district map (2002 to 2010)
US House, Michigan District 6, 2010, every candidate Candidate Party Votes and share Share RepublicanFred UptonWon Republican 123,14262.0% DemocraticDon Cooney Democratic 66,72933.6% OtherMelvin D Valkner Other 3,6721.8% LibertarianFred Strand Libertarian 3,3691.7% GreenPat Foster Green 1,7840.9% - Votes for listed candidates
- 319,646
- Election day
- November 4, 2008
- District map
- Older district map (2002 to 2010)
US House, Michigan District 6, 2008, every candidate Candidate Party Votes and share Share RepublicanFred UptonWon Republican 188,15758.9% DemocraticDon Cooney Democratic 123,25738.6% LibertarianGreg Merle Libertarian 4,7201.5% GreenEdward Pinkney Green 3,5121.1% - Votes for listed candidates
- 234,583
- Election day
- November 7, 2006
- District map
- Older district map (2002 to 2010)
US House, Michigan District 6, 2006, every candidate Candidate Party Votes and share Share RepublicanFred UptonWon Republican 142,12560.6% DemocraticKim Clark Democratic 88,97837.9% LibertarianKenneth E Howe Libertarian 3,4801.5% - Votes for listed candidates
- 302,158
- Election day
- November 2, 2004
- District map
- Older district map (2002 to 2010)
US House, Michigan District 6, 2004, every candidate Candidate Party Votes and share Share RepublicanFred UptonWon Republican 197,42565.3% DemocraticScott Elliott Democratic 97,97832.4% GreenRandall Macphee Green 2,3110.8% LibertarianErwin J Haas Libertarian 2,2750.8% OtherW Dennis Fitzsimons Other 2,1690.7% - Votes for listed candidates
- 183,517
- Election day
- November 5, 2002
- District map
- Older district map (2002 to 2010)
US House, Michigan District 6, 2002, every candidate Candidate Party Votes and share Share RepublicanFred UptonWon Republican 126,93669.2% DemocraticGary Giguere Jr Democratic 53,79329.3% OtherRichard Overton Other 2,7881.5% - Votes for listed candidates
- 234,640
- Election day
- November 7, 2000
- District map
- Older district map (1992 to 2000)
US House, Michigan District 6, 2000, every candidate Candidate Party Votes and share Share RepublicanFred UptonWon Republican 159,37367.9% DemocraticJames Bupp Democratic 68,53229.2% LibertarianWilliam Bradley Libertarian 3,5731.5% OtherRichard M Overton Other 1,8720.8% OtherC Dennis James Other 1,2900.5% - Votes for listed candidates
- 161,627
- Election day
- November 3, 1998
- District map
- Older district map (1992 to 2000)
US House, Michigan District 6, 1998, every candidate Candidate Party Votes and share Share RepublicanFred UptonWon Republican 113,29270.1% DemocraticClarence J Annen Democratic 45,35828.1% LibertarianGlenn Douglas Whitt Jr Libertarian 1,8331.1% OtherKen Asmus Other 1,0910.7% Scattered write-insName as filed: Writein Write-in 530.0% - Votes for listed candidates
- 215,834
- Election day
- November 5, 1996
- District map
- Older district map (1992 to 2000)
US House, Michigan District 6, 1996, every candidate Candidate Party Votes and share Share RepublicanFred UptonWon Republican 146,17067.7% DemocraticClarence J Annen Democratic 66,24330.7% LibertarianScott Beavers Libertarian 3,3701.6% Scattered write-insName as filed: Writein Write-in 510.0% - Votes for listed candidates
- 165,966
- Election day
- November 8, 1994
- District map
- Older district map (1992 to 2000)
US House, Michigan District 6, 1994, every candidate Candidate Party Votes and share Share RepublicanFred UptonWon Republican 121,92373.5% DemocraticDavid Taylor Democratic 42,34825.5% OtherE A Berker Other 1,6671.0% Scattered write-insName as filed: Writein Write-in 280.0% - Votes for listed candidates
- 233,112
- Election day
- November 3, 1992
- District map
- Older district map (1992 to 2000)
US House, Michigan District 6, 1992, every candidate Candidate Party Votes and share Share RepublicanFred UptonWon Republican 144,08361.8% DemocraticAndy Davis Democratic 89,02038.2% Scattered write-insName as filed: Writein Write-in 90.0% - Votes for listed candidates
- 97,791
- Election day
- November 6, 1990
- District map
- Older district map (1982 to 1990)
US House, Michigan District 6, 1990, every candidate Candidate Party Votes and share Share DemocraticBob CarrWon Democratic 97,54799.8% Scattered write-insName as filed: Writein Write-in 2440.2% - Votes for listed candidates
- 204,625
- Election day
- November 8, 1988
- District map
- Older district map (1982 to 1990)
US House, Michigan District 6, 1988, every candidate Candidate Party Votes and share Share DemocraticBob CarrWon Democratic 120,58158.9% RepublicanScott Schultz Republican 81,07939.6% LibertarianTony Wright Libertarian 1,8970.9% OtherJudith R Christensen Other 1,0630.5% OtherOther Other 50.0% - Votes for listed candidates
- 132,217
- Election day
- November 4, 1986
- District map
- Older district map (1982 to 1990)
US House, Michigan District 6, 1986, every candidate Candidate Party Votes and share Share DemocraticBob CarrWon Democratic 74,92756.7% RepublicanJim Dunn Republican 57,28343.3% Scattered write-insName as filed: Writein Write-in 70.0% - Votes for listed candidates
- 203,530
- Election day
- November 6, 1984
- District map
- Older district map (1982 to 1990)
US House, Michigan District 6, 1984, every candidate Candidate Party Votes and share Share DemocraticBob CarrWon Democratic 106,70552.4% RepublicanTom Ritter Republican 95,11346.7% OtherRussell Severance Other 9360.5% LibertarianJames E Hurrell Libertarian 7730.4% OtherOther Other 30.0% - Votes for listed candidates
- 164,987
- Election day
- November 2, 1982
- District map
- Older district map (1982 to 1990)
US House, Michigan District 6, 1982, every candidate Candidate Party Votes and share Share DemocraticBob CarrWon Democratic 84,77851.4% RepublicanJim Dunn Republican 78,38847.5% LibertarianJames E Hurrell Libertarian 1,8181.1% Scattered write-insName as filed: Writein Write-in 30.0% - Votes for listed candidates
- 219,826
- Election day
- November 4, 1980
- District map
- Older district map (1972 to 1980)
US House, Michigan District 6, 1980, every candidate Candidate Party Votes and share Share RepublicanJim DunnWon Republican 111,27250.6% DemocraticBob Carr Democratic 108,54849.4% Scattered write-insName as filed: Writein Write-in 60.0% - Votes for listed candidates
- 172,706
- Election day
- November 7, 1978
- District map
- Older district map (1972 to 1980)
US House, Michigan District 6, 1978, every candidate Candidate Party Votes and share Share DemocraticBob CarrWon Democratic 97,97156.7% RepublicanMichael H Conlin Republican 74,71843.3% Scattered write-insName as filed: Writein Write-in 170.0% - Votes for listed candidates
- 206,504
- Election day
- November 2, 1976
- District map
- Older district map (1972 to 1980)
US House, Michigan District 6, 1976, every candidate Candidate Party Votes and share Share DemocraticBob CarrWon Democratic 108,90952.7% RepublicanClifford W Taylor Republican 96,00846.5% OtherJames F McClure Other 1,3980.7% OtherAndrew Rotstein Other 1890.1%
1976 to 2024: MIT Election Data and Science Lab, U.S. House 1976-2024, retrieved Oct 28, 2026. Compiled by MIT Election Data and Science Lab (MEDSL) from official returns; not an official source
District numbers are reused after each redistricting, so rows on older lines cover different territory than today's Michigan District 6.
Download and cite
Cite this page
Election Wrld. (2026). Michigan District 6, US House results. https://www.electionwrld.com/mi/congress/6. Retrieved October 30, 2026.
Embed this seat
<iframe src="https://www.electionwrld.com/embed/mi/congress/6" title="Michigan District 6, US House" width="100%" height="400" style="border:0;max-width:640px" loading="lazy"></iframe>
<p style="font-size:13px">Data: <a href="https://www.electionwrld.com">Election Wrld</a>, CC BY 4.0</p>Sources
Sources: MIT Election Data and Science Lab, U.S. House 1976-2024 (CC0 1.0), retrieved Oct 28, 2026, compiled by MIT Election Data and Science Lab (MEDSL) from official returns, not an official source; Census TIGERweb Legislative MapServer (120th CDs layer 0, 119th CDs layer 4, 2026 SLD upper layer 1 and lower layer 2) (US Census Bureau, public domain), retrieved Oct 28, 2026; unitedstates/congress-legislators (current) (CC0-1.0), retrieved Oct 28, 2026, compiled by the @unitedstates project volunteers (rosters from official congressional sources) from official returns, not an official source.
DataState data (JSON)Sources: MIT Election Data and Science Lab, U.S. House 1976-2024, FEC, DIME (ODC-BY), Portraits: unitedstates/images (public domain)Data as of Oct 28, 2026