

Missouri District 7
Tue, Nov 3 · Seat held by Eric Burlison Republican since Jan 2023
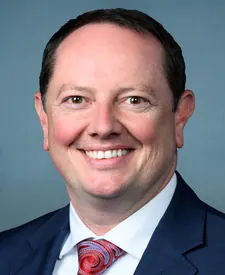
Eric Burlison 71.6Missi Hesketh 26.3
Last result · 2024 generalNo published poll names both candidates.
Show all 3 candidates on the ballot
- Missi HeskethDemocratic
- Eric BurlisonIncumbentRepublican
- Kevin CraigLibertarian
Showing major-party nominees, incumbents and candidates with 5%+ in the latest poll or comparable fundraising.
- Last election
- Eric Burlison (Republican) won by 45.3 points, 2024
- Margin since 2022
- 1.2 points toward Republicans
- On the 2026 ballot
- 3 candidates
Side by side
Left column: BurlisonRight column: Hesketh
- Total receipts, 2025-2026 cycle, through Oct 14
- $1.7M
- $51K
- Cash on hand
- $962K
- $34K
- Donor-based spectrum
- LiberalCentristConservativeBurlisonHesketh
- Races
- Won 7 of 7
- Won 0 of 1
- Years since first win
- 3
- Not available
- Age on Election Day
- 50
- Not available
Money: FEC bulk data, through Oct 14. One or more are matched to the FEC by name, party and seat, so a total could belong to someone else.
How these are counted
Total receipts line of each candidate’s principal campaign committee, 2025-2026 cycle, filed through Jul 15 and Oct 14. Other sites may show career, six-year or all-committee totals, which differ. Burlison: $1,697,442 received, $962,364 cash on hand. Hesketh: $50,540 received, $33,543 cash on hand. The spectrum is a published research score, not our rating. How this works. Wins and losses count the races in our results files, the same as each profile.
More about this race
Candidates on the ballot
- Missi HeskethDemocratic
- Eric BurlisonIncumbentRepublican
- Kevin CraigLibertarian
Source: sos.mo.gov (PDF), dated Aug 25
Shift since 2022: 1.2 points toward Republicans (Republican by 44.1 in 2022, Republican by 45.3 in 2024).
All Missouri districts
- D 15+ pts
- D 5 to 15 pts
- D under 5 pts
- R under 5 pts
- R 5 to 15 pts
- R 15+ pts
- Other winner
- No data
Show these districts as a list (8)
- Missouri District 1· Wesley Bell (D), Democratic by 57.5 points, 2024
- Missouri District 2· Ann Wagner (R), Republican by 12.0 points, 2024
- Missouri District 3· Robert F. Onder, Jr. (R), Republican by 26.0 points, 2024
- Missouri District 4· Mark Alford (R), Republican by 44.7 points, 2024
- Missouri District 5· Emanuel Cleaver (D), Democratic by 23.8 points, 2024
- Missouri District 6· Sam Graves (R), Republican by 43.8 points, 2024
- Missouri District 7· Eric Burlison (R), Republican by 45.3 points, 2024
- Missouri District 8· Jason Smith (R), Republican by 54.4 points, 2024
Map settings
Vote in Missouri
Trouble voting? Election Protection hotline: 866-OUR-VOTE. A nonpartisan coalition of civil-rights and voting-rights groups, not a government service. 866ourvote.org
History (25 elections for this seat)
- Votes for listed candidates
- 367,868
- Election day
- November 5, 2024
- District map
- Same as today
US House, Missouri District 7, 2024, every candidate Candidate Party Votes and share Share RepublicanEric BurlisonWon Republican 263,23171.6% DemocraticMissi Hesketh Democratic 96,65526.3% LibertarianKevin Craig Libertarian 7,9822.2% - Votes for listed candidates
- 251,947
- Election day
- November 8, 2022
- District map
- Same as today
US House, Missouri District 7, 2022, every candidate Candidate Party Votes and share Share RepublicanEric BurlisonWon Republican 178,59270.9% DemocraticKristen Radaker-Sheafer Democratic 67,48526.8% LibertarianKevin Craig Libertarian 5,8692.3% OtherRoger A Rekate Other 10.0% - Votes for listed candidates
- 369,283
- Election day
- November 3, 2020
- District map
- Older district map (2012 to 2020)
US House, Missouri District 7, 2020, every candidate Candidate Party Votes and share Share RepublicanBilly LongWon Republican 254,31868.9% DemocraticTeresa Montseny Democratic 98,11126.6% LibertarianKevin Craig Libertarian 15,5734.2% Audrey Richards Write-in 1,2790.3% Dennis Davis Write-in 20.0% - Votes for listed candidates
- 296,455
- Election day
- November 6, 2018
- District map
- Older district map (2012 to 2020)
US House, Missouri District 7, 2018, every candidate Candidate Party Votes and share Share RepublicanBilly LongWon Republican 196,34366.2% DemocraticJamie Daniel Schoolcraft Democratic 89,19030.1% LibertarianBenjamin T Brixey Libertarian 10,9203.7% Scattered write-insName as filed: Writein Write-in 20.0% - Votes for listed candidates
- 338,607
- Election day
- November 8, 2016
- District map
- Older district map (2012 to 2020)
US House, Missouri District 7, 2016, every candidate Candidate Party Votes and share Share RepublicanBilly LongWon Republican 228,69267.5% DemocraticGenevieve "Gen" Williams Democratic 92,75627.4% LibertarianBenjamin T Brixey Libertarian 17,1535.1% Scattered write-insName as filed: Writein Write-in 60.0% - Votes for listed candidates
- 163,957
- Election day
- November 4, 2014
- District map
- Older district map (2012 to 2020)
US House, Missouri District 7, 2014, every candidate Candidate Party Votes and share Share RepublicanBilly LongWon Republican 104,05463.5% DemocraticJim Evans Democratic 47,28228.8% LibertarianKevin Craig Libertarian 12,5847.7% Scattered write-insName as filed: Writein Write-in 370.0% - Votes for listed candidates
- 318,740
- Election day
- November 6, 2012
- District map
- Older district map (2012 to 2020)
US House, Missouri District 7, 2012, every candidate Candidate Party Votes and share Share RepublicanBilly LongWon Republican 203,56563.9% DemocraticJim Evans Democratic 98,49830.9% LibertarianKevin Craig Libertarian 16,6685.2% Scattered write-insName as filed: Writein Write-in 90.0% - Votes for listed candidates
- 222,431
- Election day
- November 2, 2010
- District map
- Older district map (2002 to 2010)
US House, Missouri District 7, 2010, every candidate Candidate Party Votes and share Share RepublicanBilly LongWon Republican 141,01063.4% DemocraticScott Eckersley Democratic 67,54530.4% LibertarianKevin Craig Libertarian 13,8666.2% Scattered write-insName as filed: Writein Write-in 100.0% - Votes for listed candidates
- 323,212
- Election day
- November 4, 2008
- District map
- Older district map (2002 to 2010)
US House, Missouri District 7, 2008, every candidate Candidate Party Votes and share Share RepublicanRoy BluntWon Republican 219,01667.8% DemocraticRichard Monroe Democratic 91,01028.2% LibertarianKevin Craig Libertarian 6,9712.2% OtherTravis Maddox Other 6,1661.9% Scattered write-insName as filed: Writein Write-in 490.0% - Votes for listed candidates
- 241,123
- Election day
- November 7, 2006
- District map
- Older district map (2002 to 2010)
US House, Missouri District 7, 2006, every candidate Candidate Party Votes and share Share RepublicanRoy BluntWon Republican 160,94266.7% DemocraticJack Truman Democratic 72,59230.1% LibertarianKevin Craig Libertarian 7,5663.1% Scattered write-insName as filed: Writein Write-in 230.0% - Votes for listed candidates
- 298,205
- Election day
- November 2, 2004
- District map
- Older district map (2002 to 2010)
US House, Missouri District 7, 2004, every candidate Candidate Party Votes and share Share RepublicanRoy BluntWon Republican 210,08070.4% DemocraticJim Newberry Democratic 84,35628.3% LibertarianKevin Craig Libertarian 2,7670.9% OtherSteve Alger Other 1,0020.3% - Votes for listed candidates
- 199,863
- Election day
- November 5, 2002
- District map
- Older district map (2002 to 2010)
US House, Missouri District 7, 2002, every candidate Candidate Party Votes and share Share RepublicanRoy BluntWon Republican 149,51974.8% DemocraticRon Lapham Democratic 45,96423.0% LibertarianDoug Burlison Libertarian 4,3782.2% Scattered write-insName as filed: Writein Write-in 20.0% - Votes for listed candidates
- 273,937
- Election day
- November 7, 2000
- District map
- Older district map (1992 to 2000)
US House, Missouri District 7, 2000, every candidate Candidate Party Votes and share Share RepublicanRoy BluntWon Republican 202,30573.9% DemocraticCharles Christrup Democratic 65,51023.9% LibertarianDoug Burlison Libertarian 2,9651.1% OtherSharalyn Harris Other 2,1690.8% OtherRon Lapham Other 9880.4% - Votes for listed candidates
- 178,801
- Election day
- November 3, 1998
- District map
- Older district map (1992 to 2000)
US House, Missouri District 7, 1998, every candidate Candidate Party Votes and share Share RepublicanRoy BluntWon Republican 129,74672.6% DemocraticMarc Perkel Democratic 43,41624.3% LibertarianMike Harman Libertarian 5,6393.2% - Votes for listed candidates
- 250,584
- Election day
- November 5, 1996
- District map
- Older district map (1992 to 2000)
US House, Missouri District 7, 1996, every candidate Candidate Party Votes and share Share RepublicanRoy BluntWon Republican 162,55864.9% DemocraticRuth Bamberger Democratic 79,30631.6% LibertarianMike Harman Libertarian 6,5432.6% OtherSharalyn Harris Other 2,1770.9% - Votes for listed candidates
- 195,916
- Election day
- November 8, 1994
- District map
- Older district map (1992 to 2000)
US House, Missouri District 7, 1994, every candidate Candidate Party Votes and share Share RepublicanMel HancockWon Republican 112,22857.3% DemocraticJames R Fossard Democratic 77,83639.7% LibertarianDoug Burlison Libertarian 5,8523.0% - Votes for listed candidates
- 260,065
- Election day
- November 3, 1992
- District map
- Older district map (1992 to 2000)
US House, Missouri District 7, 1992, every candidate Candidate Party Votes and share Share RepublicanMel HancockWon Republican 160,30361.6% DemocraticThomas Patrick "Pat" Deaton Democratic 99,76238.4% - Votes for listed candidates
- 160,334
- Election day
- November 6, 1990
- District map
- Older district map (1982 to 1990)
US House, Missouri District 7, 1990, every candidate Candidate Party Votes and share Share RepublicanMel HancockWon Republican 83,60952.1% DemocraticThomas Patrick "Pat" Deaton Democratic 76,72547.9% - Votes for listed candidates
- 240,911
- Election day
- November 8, 1988
- District map
- Older district map (1982 to 1990)
US House, Missouri District 7, 1988, every candidate Candidate Party Votes and share Share RepublicanMel HancockWon Republican 127,93953.1% DemocraticMax Bacon Democratic 111,24446.2% LibertarianRob Lurvey Libertarian 1,7280.7% - Votes for listed candidates
- 170,501
- Election day
- November 4, 1986
- District map
- Older district map (1982 to 1990)
US House, Missouri District 7, 1986, every candidate Candidate Party Votes and share Share RepublicanGene TaylorWon Republican 114,21067.0% DemocraticKen Young Democratic 56,29133.0% - Votes for listed candidates
- 236,453
- Election day
- November 6, 1984
- District map
- Older district map (1982 to 1990)
US House, Missouri District 7, 1984, every candidate Candidate Party Votes and share Share RepublicanGene TaylorWon Republican 164,58669.6% DemocraticKen Young Democratic 71,86730.4% - Votes for listed candidates
- 180,940
- Election day
- November 2, 1982
- District map
- Older district map (1982 to 1990)
US House, Missouri District 7, 1982, every candidate Candidate Party Votes and share Share RepublicanGene TaylorWon Republican 91,39150.5% DemocraticDavid A Geisler Democratic 89,54949.5% - Votes for listed candidates
- 238,512
- Election day
- November 4, 1980
- District map
- Older district map (1972 to 1980)
US House, Missouri District 7, 1980, every candidate Candidate Party Votes and share Share RepublicanGene TaylorWon Republican 161,66867.8% DemocraticKen Young Democratic 76,84432.2% - Votes for listed candidates
- 170,917
- Election day
- November 7, 1978
- District map
- Older district map (1972 to 1980)
US House, Missouri District 7, 1978, every candidate Candidate Party Votes and share Share RepublicanGene TaylorWon Republican 104,56661.2% DemocraticJim Thomas Democratic 66,35138.8% - Votes for listed candidates
- 215,504
- Election day
- November 2, 1976
- District map
- Older district map (1972 to 1980)
US House, Missouri District 7, 1976, every candidate Candidate Party Votes and share Share RepublicanGene TaylorWon Republican 133,65662.0% DemocraticDolan G Hawkins Democratic 81,84838.0%
1976 to 2024: MIT Election Data and Science Lab, U.S. House 1976-2024, retrieved Oct 28, 2026. Compiled by MIT Election Data and Science Lab (MEDSL) from official returns; not an official source
District numbers are reused after each redistricting, so rows on older lines cover different territory than today's Missouri District 7.
Download and cite
Cite this page
Election Wrld. (2026). Missouri District 7, US House results. https://www.electionwrld.com/mo/congress/7. Retrieved October 30, 2026.
Embed this seat
<iframe src="https://www.electionwrld.com/embed/mo/congress/7" title="Missouri District 7, US House" width="100%" height="400" style="border:0;max-width:640px" loading="lazy"></iframe>
<p style="font-size:13px">Data: <a href="https://www.electionwrld.com">Election Wrld</a>, CC BY 4.0</p>Sources
Sources: MIT Election Data and Science Lab, U.S. House 1976-2024 (CC0 1.0), retrieved Oct 28, 2026, compiled by MIT Election Data and Science Lab (MEDSL) from official returns, not an official source; Census TIGERweb Legislative MapServer (120th CDs layer 0, 119th CDs layer 4, 2026 SLD upper layer 1 and lower layer 2) (US Census Bureau, public domain), retrieved Oct 28, 2026; unitedstates/congress-legislators (current) (CC0-1.0), retrieved Oct 28, 2026, compiled by the @unitedstates project volunteers (rosters from official congressional sources) from official returns, not an official source.
DataState data (JSON)Sources: MIT Election Data and Science Lab, U.S. House 1976-2024, FEC, DIME (ODC-BY), Portraits: unitedstates/images (public domain)Data as of Oct 28, 2026