

Oklahoma District 2
Tue, Nov 3 · Seat held by Josh Brecheen Republican since Jan 2023
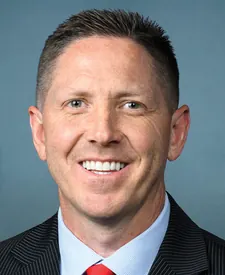
Josh Brecheen 74.2Brandon Wade 21.4
Last result · 2024 generalNo published poll names both candidates.
Show all 3 candidates on the ballot
- Brandon WadeDemocratic
- Josh BrecheenIncumbentRepublican
- Ronnie HopkinsIndependent
Showing major-party nominees, incumbents and candidates with 5%+ in the latest poll or comparable fundraising.
- Last election
- Josh Brecheen (Republican) won by 52.8 points, 2024
- Margin since 2022
- 3.8 points toward Republicans
- On the 2026 ballot
- 3 candidates
Side by side
Left column: BrecheenRight column: Wade
- Total receipts, 2025-2026 cycle, through Oct 14
- $250K
- $8K
- Cash on hand
- $71K
- −$280
- Donor-based spectrum
- LiberalCentristConservativeBrecheenWade
- Races
- Won 4 of 4
- Won 0 of 1
- Years since first win
- 3
- Not available
- Age on Election Day
- 47
- Not available
Money: FEC bulk data, through Oct 14. One or more are matched to the FEC by name, party and seat, so a total could belong to someone else.
How these are counted
Total receipts line of each candidate’s principal campaign committee, 2025-2026 cycle. Other sites may show career, six-year or all-committee totals, which differ. Brecheen: $250,176 received, $71,201 cash on hand. Wade: $7,983 received, $-280 cash on hand. The spectrum is a published research score, not our rating. How this works. Wins and losses count the races in our results files, the same as each profile.
More about this race
Candidates on the ballot
- Brandon WadeDemocratic
- Josh BrecheenIncumbentRepublican
- Ronnie HopkinsIndependent
Source: hosting.okelections.us, dated Oct 28
Shift since 2022: 3.8 points toward Republicans (Republican by 49.0 in 2022, Republican by 52.8 in 2024).
All Oklahoma districts
- D 15+ pts
- D 5 to 15 pts
- D under 5 pts
- R under 5 pts
- R 5 to 15 pts
- R 15+ pts
- Other winner
- No data
Show these districts as a list (5)
- Oklahoma District 1· Kevin Hern (R), Republican by 25.9 points, 2024
- Oklahoma District 2· Josh Brecheen (R), Republican by 52.8 points, 2024
- Oklahoma District 3· Frank D. Lucas (R), unopposed, 2024
- Oklahoma District 4· Tom Cole (R), Republican by 36.9 points, 2024
- Oklahoma District 5· Stephanie I. Bice (R), Republican by 21.4 points, 2024
Map settings
Vote in Oklahoma
- Register
- Registration, polling place, sample ballot lookup, mail ballot status, election office
- ID rules
Trouble voting? Election Protection hotline: 866-OUR-VOTE. A nonpartisan coalition of civil-rights and voting-rights groups, not a government service. 866ourvote.org
History (25 elections for this seat)
- Votes for listed candidates
- 321,025
- Election day
- November 5, 2024
- District map
- Same as today
US House, Oklahoma District 2, 2024, every candidate Candidate Party Votes and share Share RepublicanJosh BrecheenWon Republican 238,12374.2% DemocraticBrandon Wade Democratic 68,84121.4% IndependentRonnie Hopkins Independent 14,0614.4% - Votes for listed candidates
- 231,672
- Election day
- November 8, 2022
- District map
- Same as today
US House, Oklahoma District 2, 2022, every candidate Candidate Party Votes and share Share RepublicanJosh BrecheenWon Republican 167,84372.4% DemocraticNaomi Andrews Democratic 54,19423.4% IndependentBulldog Ben Robinson Independent 9,6354.2% - Votes for listed candidates
- 288,527
- Election day
- November 3, 2020
- District map
- Older district map (2012 to 2020)
US House, Oklahoma District 2, 2020, every candidate Candidate Party Votes and share Share RepublicanMarkwayne MullinWon Republican 216,51175.0% DemocraticDanyell Lanier Democratic 63,47222.0% LibertarianRichie Castaldo Libertarian 8,5443.0% - Votes for listed candidates
- 216,002
- Election day
- November 6, 2018
- District map
- Older district map (2012 to 2020)
US House, Oklahoma District 2, 2018, every candidate Candidate Party Votes and share Share RepublicanMarkwayne MullinWon Republican 140,45165.0% DemocraticJason Nichols Democratic 65,02130.1% IndependentJohn Foreman Independent 6,3903.0% LibertarianRichard Castaldo Libertarian 4,1401.9% - Votes for listed candidates
- 268,870
- Election day
- November 8, 2016
- District map
- Older district map (2012 to 2020)
US House, Oklahoma District 2, 2016, every candidate Candidate Party Votes and share Share RepublicanMarkwayne MullinWon Republican 189,83970.6% DemocraticJoshua Harris-Till Democratic 62,38723.2% IndependentJohn McCarthy Independent 16,6446.2% - Votes for listed candidates
- 158,407
- Election day
- November 4, 2014
- District map
- Older district map (2012 to 2020)
US House, Oklahoma District 2, 2014, every candidate Candidate Party Votes and share Share RepublicanMarkwayne MullinWon Republican 110,92570.0% DemocraticEarl E Everett Democratic 38,96424.6% IndependentJon Douthitt Independent 8,5185.4% - Votes for listed candidates
- 250,612
- Election day
- November 6, 2012
- District map
- Older district map (2012 to 2020)
US House, Oklahoma District 2, 2012, every candidate Candidate Party Votes and share Share RepublicanMarkwayne MullinWon Republican 143,70157.3% DemocraticRob Wallace Democratic 96,08138.3% IndependentMichael G Fulks Independent 10,8304.3% - Votes for listed candidates
- 191,429
- Election day
- November 2, 2010
- District map
- Older district map (2002 to 2010)
US House, Oklahoma District 2, 2010, every candidate Candidate Party Votes and share Share DemocraticDan BorenWon Democratic 108,20356.5% RepublicanCharles Thompson Republican 83,22643.5% - Votes for listed candidates
- 246,572
- Election day
- November 4, 2008
- District map
- Older district map (2002 to 2010)
US House, Oklahoma District 2, 2008, every candidate Candidate Party Votes and share Share DemocraticDan BorenWon Democratic 173,75770.5% RepublicanRaymond J Wickson Republican 72,81529.5% - Votes for listed candidates
- 168,208
- Election day
- November 7, 2006
- District map
- Older district map (2002 to 2010)
US House, Oklahoma District 2, 2006, every candidate Candidate Party Votes and share Share DemocraticDan BorenWon Democratic 122,34772.7% RepublicanPatrick K Miller Republican 45,86127.3% - Votes for listed candidates
- 272,542
- Election day
- November 2, 2004
- District map
- Older district map (2002 to 2010)
US House, Oklahoma District 2, 2004, every candidate Candidate Party Votes and share Share DemocraticDan BorenWon Democratic 179,57965.9% RepublicanWayland Smalley Republican 92,96334.1% - Votes for listed candidates
- 197,982
- Election day
- November 5, 2002
- District map
- Older district map (2002 to 2010)
US House, Oklahoma District 2, 2002, every candidate Candidate Party Votes and share Share DemocraticBrad CarsonWon Democratic 146,74874.1% RepublicanKent Pharaoh Republican 51,23425.9% - Votes for listed candidates
- 195,412
- Election day
- November 7, 2000
- District map
- Older district map (1992 to 2000)
US House, Oklahoma District 2, 2000, every candidate Candidate Party Votes and share Share DemocraticBrad CarsonWon Democratic 107,27354.9% RepublicanAndy Ewing Republican 81,67241.8% LibertarianNeil Mavis Libertarian 6,4673.3% - Votes for listed candidates
- 148,264
- Election day
- November 3, 1998
- District map
- Older district map (1992 to 2000)
US House, Oklahoma District 2, 1998, every candidate Candidate Party Votes and share Share RepublicanTom A CoburnWon Republican 85,58157.7% DemocraticKent Pharaoh Democratic 59,04239.8% IndependentAlbert Jones Independent 3,6412.5% - Votes for listed candidates
- 202,393
- Election day
- November 5, 1996
- District map
- Older district map (1992 to 2000)
US House, Oklahoma District 2, 1996, every candidate Candidate Party Votes and share Share RepublicanTom A CoburnWon Republican 112,27355.5% DemocraticGlen D Johnson Democratic 90,12044.5% - Votes for listed candidates
- 158,422
- Election day
- November 8, 1994
- District map
- Older district map (1992 to 2000)
US House, Oklahoma District 2, 1994, every candidate Candidate Party Votes and share Share RepublicanTom A CoburnWon Republican 82,47952.1% DemocraticVirgil R Cooper Democratic 75,94347.9% - Votes for listed candidates
- 213,513
- Election day
- November 3, 1992
- District map
- Older district map (1992 to 2000)
US House, Oklahoma District 2, 1992, every candidate Candidate Party Votes and share Share DemocraticMike SynarWon Democratic 118,54255.5% RepublicanJerry Hill Republican 87,65741.1% IndependentWilliam S Vardeman Independent 7,3143.4% - Votes for listed candidates
- 148,151
- Election day
- November 6, 1990
- District map
- Older district map (1982 to 1990)
US House, Oklahoma District 2, 1990, every candidate Candidate Party Votes and share Share DemocraticMike SynarWon Democratic 90,82061.3% RepublicanTerry M Gorham Republican 57,33138.7% - Votes for listed candidates
- 209,668
- Election day
- November 8, 1988
- District map
- Older district map (1982 to 1990)
US House, Oklahoma District 2, 1988, every candidate Candidate Party Votes and share Share DemocraticMike SynarWon Democratic 136,00964.9% RepublicanIra Phillips Republican 73,65935.1% - Votes for listed candidates
- 156,338
- Election day
- November 4, 1986
- District map
- Older district map (1982 to 1990)
US House, Oklahoma District 2, 1986, every candidate Candidate Party Votes and share Share DemocraticMike SynarWon Democratic 114,54373.3% RepublicanGary K Rice Republican 41,79526.7% - Votes for listed candidates
- 200,013
- Election day
- November 6, 1984
- District map
- Older district map (1982 to 1990)
US House, Oklahoma District 2, 1984, every candidate Candidate Party Votes and share Share DemocraticMike SynarWon Democratic 148,12474.1% RepublicanGary K Rice Republican 51,88925.9% - Votes for listed candidates
- 154,193
- Election day
- November 2, 1982
- District map
- Older district map (1982 to 1990)
US House, Oklahoma District 2, 1982, every candidate Candidate Party Votes and share Share DemocraticMike SynarWon Democratic 111,89572.6% RepublicanLou Striegel Republican 42,29827.4% - Votes for listed candidates
- 188,060
- Election day
- November 4, 1980
- District map
- Older district map (1972 to 1980)
US House, Oklahoma District 2, 1980, every candidate Candidate Party Votes and share Share DemocraticMike SynarWon Democratic 101,51654.0% RepublicanGary Richardson Republican 86,54446.0% - Votes for listed candidates
- 132,436
- Election day
- November 7, 1978
- District map
- Older district map (1972 to 1980)
US House, Oklahoma District 2, 1978, every candidate Candidate Party Votes and share Share DemocraticMichael Lynn SynarWon Democratic 72,58354.8% RepublicanGary Richardson Republican 59,85345.2% - Votes for listed candidates
- 189,743
- Election day
- November 2, 1976
- District map
- Older district map (1972 to 1980)
US House, Oklahoma District 2, 1976, every candidate Candidate Party Votes and share Share DemocraticTheodore M "Ted" RisenhooverWon Democratic 102,40254.0% RepublicanBud Stewart Republican 87,34146.0%
1976 to 2024: MIT Election Data and Science Lab, U.S. House 1976-2024, retrieved Oct 28, 2026. Compiled by MIT Election Data and Science Lab (MEDSL) from official returns; not an official source
District numbers are reused after each redistricting, so rows on older lines cover different territory than today's Oklahoma District 2.
Download and cite
Cite this page
Election Wrld. (2026). Oklahoma District 2, US House results. https://www.electionwrld.com/ok/congress/2. Retrieved October 30, 2026.
Embed this seat
<iframe src="https://www.electionwrld.com/embed/ok/congress/2" title="Oklahoma District 2, US House" width="100%" height="400" style="border:0;max-width:640px" loading="lazy"></iframe>
<p style="font-size:13px">Data: <a href="https://www.electionwrld.com">Election Wrld</a>, CC BY 4.0</p>Sources
Sources: MIT Election Data and Science Lab, U.S. House 1976-2024 (CC0 1.0), retrieved Oct 28, 2026, compiled by MIT Election Data and Science Lab (MEDSL) from official returns, not an official source; Census TIGERweb Legislative MapServer (120th CDs layer 0, 119th CDs layer 4, 2026 SLD upper layer 1 and lower layer 2) (US Census Bureau, public domain), retrieved Oct 28, 2026; unitedstates/congress-legislators (current) (CC0-1.0), retrieved Oct 28, 2026, compiled by the @unitedstates project volunteers (rosters from official congressional sources) from official returns, not an official source.
DataState data (JSON)Sources: MIT Election Data and Science Lab, U.S. House 1976-2024, FEC, DIME (ODC-BY), Portraits: unitedstates/images (public domain)Data as of Oct 28, 2026