

South Carolina District 6
Tue, Nov 3 · Seat held by James E. Clyburn Democratic since Jan 1993
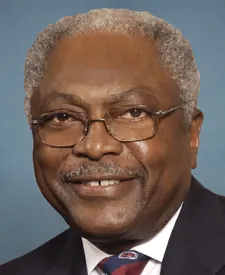
No published poll names both candidates.Last result · 2024 general: James E. Clyburn (D) 59.5, Duke Buckner (R) 36.7, Michael Simpson (L) 1.7
- Last election
- James E. Clyburn (Democratic) won by 22.8 points, 2024
- Margin since 2022
- 1.3 points toward Republicans
- On the 2026 ballot
- 2 candidates
Side by side
Left column: ClyburnRight column: Peterson
- Total receipts, 2025-2026 cycle, through Oct 14
- $1.7M
- No FEC report
- Cash on hand
- $1.8M
- No FEC report
- Donor-based spectrum
- LiberalCentristConservativeClyburnNo published score for Peterson
- Races
- Won 16 of 16
- None listed
- Years since first win
- 33
- Not available
- Age on Election Day
- 86
- Not available
Money: FEC bulk data, through Oct 14. One or more are matched to the FEC by name, party and seat, so a total could belong to someone else.
How these are counted
Total receipts line of each candidate’s principal campaign committee, 2025-2026 cycle. Other sites may show career, six-year or all-committee totals, which differ. Clyburn: $1,687,458 received, $1,827,711 cash on hand. The spectrum is a published research score, not our rating. How this works. Wins and losses count the races in our results files, the same as each profile.
More about this race
Candidates on the ballot
- James E. ClyburnIncumbentDemocratic
- John PetersonRepublican
Source: vrems.scvotes.sc.gov, dated Oct 28
Shift since 2022: 1.3 points toward Republicans (Democratic by 24.1 in 2022, Democratic by 22.8 in 2024).
All South Carolina districts
- D 15+ pts
- D 5 to 15 pts
- D under 5 pts
- R under 5 pts
- R 5 to 15 pts
- R 15+ pts
- Other winner
- No data
Show these districts as a list (7)
- South Carolina District 1· Nancy Mace (R), Republican by 16.6 points, 2024
- South Carolina District 2· Joe Wilson (R), Republican by 19.3 points, 2024
- South Carolina District 3· Sheri Biggs (R), Republican by 46.4 points, 2024
- South Carolina District 4· William R. Timmons IV (R), Republican by 22.5 points, 2024
- South Carolina District 5· Ralph Norman (R), Republican by 27.2 points, 2024
- South Carolina District 6· James E. Clyburn (D), Democratic by 22.8 points, 2024
- South Carolina District 7· Russell Fry (R), Republican by 29.9 points, 2024
Map settings
Vote in South Carolina
Trouble voting? Election Protection hotline: 866-OUR-VOTE. A nonpartisan coalition of civil-rights and voting-rights groups, not a government service. 866ourvote.org
Official results for South Carolina
History (25 elections for this seat)
- Votes for listed candidates
- 305,977
- Election day
- November 5, 2024
- District map
- Same as today
US House, South Carolina District 6, 2024, every candidate Candidate Party Votes and share Share DemocraticJames E. ClyburnWon Democratic 182,05659.5% RepublicanDuke Buckner Republican 112,36036.7% LibertarianMichael Simpson Libertarian 5,2791.7% OtherGregg Marcel Dixon Other 4,9271.6% OtherJoseph Oddo Other 1,0560.3% Scattered write-insName as filed: Writein Write-in 2990.1% - Votes for listed candidates
- 211,028
- Election day
- November 8, 2022
- District map
- Same as today
US House, South Carolina District 6, 2022, every candidate Candidate Party Votes and share Share DemocraticJames E. ClyburnWon Democratic 130,92362.0% RepublicanDuke Buckner Republican 79,87937.9% Scattered write-insName as filed: Writein Write-in 2260.1% - Votes for listed candidates
- 289,653
- Election day
- November 3, 2020
- District map
- Older district map (2012 to 2020)
US House, South Carolina District 6, 2020, every candidate Candidate Party Votes and share Share DemocraticJames E. ClyburnWon Democratic 197,47768.2% RepublicanJohn McCollum Republican 89,25830.8% OtherMark Hackett Other 2,6460.9% Scattered write-insName as filed: Writein Write-in 2720.1% - Votes for listed candidates
- 206,433
- Election day
- November 6, 2018
- District map
- Older district map (2012 to 2020)
US House, South Carolina District 6, 2018, every candidate Candidate Party Votes and share Share DemocraticJames E. ClyburnWonName as filed: James E Jim Clyburn Democratic 144,76570.1% RepublicanGerhard R Gressmann Republican 58,28228.2% GreenBryan Pugh Green 3,2141.6% Scattered write-insName as filed: Writein Write-in 1720.1% - Votes for listed candidates
- 253,901
- Election day
- November 8, 2016
- District map
- Older district map (2012 to 2020)
US House, South Carolina District 6, 2016, every candidate Candidate Party Votes and share Share DemocraticJames E. ClyburnWon Democratic 177,94770.1% RepublicanLaura Sterling Republican 70,09927.6% LibertarianRich Piotrowski Libertarian 3,1311.2% GreenPrince Charles Mallory Green 2,4991.0% Scattered write-insName as filed: Writein Write-in 2250.1% - Votes for listed candidates
- 173,432
- Election day
- November 4, 2014
- District map
- Older district map (2012 to 2020)
US House, South Carolina District 6, 2014, every candidate Candidate Party Votes and share Share DemocraticJames E. ClyburnWon Democratic 125,74772.5% RepublicanAnthony Culler Republican 44,31125.5% LibertarianKevin R Umbaugh Libertarian 3,1761.8% Scattered write-insName as filed: Writein Write-in 1980.1% - Votes for listed candidates
- 233,615
- Election day
- November 6, 2012
- District map
- Older district map (2012 to 2020)
US House, South Carolina District 6, 2012, every candidate Candidate Party Votes and share Share DemocraticJames E. ClyburnWon Democratic 218,71793.6% GreenNammu Y Muhammad Green 12,9205.5% Scattered write-insName as filed: Writein Write-in 1,9780.8% - Votes for listed candidates
- 199,590
- Election day
- November 2, 2010
- District map
- Older district map (2002 to 2010)
US House, South Carolina District 6, 2010, every candidate Candidate Party Votes and share Share DemocraticJames E. ClyburnWon Democratic 125,45962.9% RepublicanJim Pratt Republican 72,66136.4% GreenNammu Y Muhammad Green 1,3890.7% Scattered write-insName as filed: Writein Write-in 810.0% - Votes for listed candidates
- 286,571
- Election day
- November 4, 2008
- District map
- Older district map (2002 to 2010)
US House, South Carolina District 6, 2008, every candidate Candidate Party Votes and share Share DemocraticJames E. ClyburnWon Democratic 193,37867.5% RepublicanNancy Harrelson Republican 93,05932.5% Scattered write-insName as filed: Writein Write-in 1340.0% - Votes for listed candidates
- 155,706
- Election day
- November 7, 2006
- District map
- Older district map (2002 to 2010)
US House, South Carolina District 6, 2006, every candidate Candidate Party Votes and share Share DemocraticJames E. ClyburnWon Democratic 100,21364.4% RepublicanGary McLeod Republican 53,18134.2% GreenAntonio Williams Green 2,2241.4% Scattered write-insName as filed: Writein Write-in 880.1% - Votes for listed candidates
- 241,829
- Election day
- November 2, 2004
- District map
- Older district map (2002 to 2010)
US House, South Carolina District 6, 2004, every candidate Candidate Party Votes and share Share DemocraticJames E. ClyburnWon Democratic 161,98767.0% RepublicanGary McLeod Republican 79,60032.9% Scattered write-insName as filed: Writein Write-in 2420.1% - Votes for listed candidates
- 173,047
- Election day
- November 5, 2002
- District map
- Older district map (2002 to 2010)
US House, South Carolina District 6, 2002, every candidate Candidate Party Votes and share Share DemocraticJames E. ClyburnWon Democratic 115,85567.0% RepublicanGary McLeod Republican 55,49032.1% LibertarianR Craig Augenstein Libertarian 1,6621.0% Scattered write-insName as filed: Writein Write-in 400.0% - Votes for listed candidates
- 192,380
- Election day
- November 7, 2000
- District map
- Older district map (1992 to 2000)
US House, South Carolina District 6, 2000, every candidate Candidate Party Votes and share Share DemocraticJames E. ClyburnWon Democratic 138,05371.8% RepublicanVince Ellison Republican 50,00526.0% OtherDianne L Nevins Other 2,3391.2% LibertarianLynwood Earl Hines Libertarian 1,9341.0% Scattered write-insName as filed: Writein Write-in 490.0% - Votes for listed candidates
- 160,576
- Election day
- November 3, 1998
- District map
- Older district map (1992 to 2000)
US House, South Carolina District 6, 1998, every candidate Candidate Party Votes and share Share DemocraticJames E. ClyburnWon Democratic 116,50772.6% RepublicanGary McLeod Republican 41,42125.8% OtherGeorge C Taylor Other 2,4961.6% Scattered write-insName as filed: Writein Write-in 1520.1% - Votes for listed candidates
- 173,054
- Election day
- November 5, 1996
- District map
- Older district map (1992 to 2000)
US House, South Carolina District 6, 1996, every candidate Candidate Party Votes and share Share DemocraticJames E. ClyburnWon Democratic 120,13269.4% RepublicanGary McLeod Republican 51,97430.0% OtherSavitap Joshi Other 9480.5% - Votes for listed candidates
- 138,923
- Election day
- November 8, 1994
- District map
- Older district map (1992 to 2000)
US House, South Carolina District 6, 1994, every candidate Candidate Party Votes and share Share DemocraticJames E. ClyburnWon Democratic 88,63563.8% RepublicanGary McLeod Republican 50,25936.2% Scattered write-insName as filed: Writein Write-in 290.0% - Votes for listed candidates
- 184,871
- Election day
- November 3, 1992
- District map
- Older district map (1992 to 2000)
US House, South Carolina District 6, 1992, every candidate Candidate Party Votes and share Share DemocraticJames E ClybrunWon Democratic 120,64765.3% RepublicanJohn Chase Republican 64,14934.7% Scattered write-insName as filed: Writein Write-in 750.0% - Votes for listed candidates
- 94,524
- Election day
- November 6, 1990
- District map
- Older district map (1982 to 1990)
US House, South Carolina District 6, 1990, every candidate Candidate Party Votes and share Share DemocraticRobin TallonWon Democratic 94,12199.6% Scattered write-insName as filed: Writein Write-in 4030.4% - Votes for listed candidates
- 158,677
- Election day
- November 8, 1988
- District map
- Older district map (1982 to 1990)
US House, South Carolina District 6, 1988, every candidate Candidate Party Votes and share Share DemocraticRobin TallonWon Democratic 120,71976.1% RepublicanBob Cunningham Republican 37,95823.9% - Votes for listed candidates
- 122,343
- Election day
- November 4, 1986
- District map
- Older district map (1982 to 1990)
US House, South Carolina District 6, 1986, every candidate Candidate Party Votes and share Share DemocraticRobin TallonWon Democratic 92,39875.5% RepublicanRobbie Cunningham Republican 29,92224.5% Scattered write-insName as filed: Writein Write-in 230.0% - Votes for listed candidates
- 162,384
- Election day
- November 6, 1984
- District map
- Older district map (1982 to 1990)
US House, South Carolina District 6, 1984, every candidate Candidate Party Votes and share Share DemocraticRobin TallonWon Democratic 97,32959.9% RepublicanLois Eargle Republican 63,00538.8% LibertarianHugh Thompson Libertarian 2,0501.3% - Votes for listed candidates
- 119,235
- Election day
- November 2, 1982
- District map
- Older district map (1982 to 1990)
US House, South Carolina District 6, 1982, every candidate Candidate Party Votes and share Share DemocraticRobin TallonWon Democratic 62,58252.5% RepublicanJohn L Napier Republican 56,65347.5% - Votes for listed candidates
- 146,711
- Election day
- November 4, 1980
- District map
- Older district map (1972 to 1980)
US House, South Carolina District 6, 1980, every candidate Candidate Party Votes and share Share RepublicanJohn L NapierWon Republican 75,96451.8% DemocraticJohn W Jenrette Jr Democratic 70,74748.2% - Votes for listed candidates
- 69,220
- Election day
- November 7, 1978
- District map
- Older district map (1972 to 1980)
US House, South Carolina District 6, 1978, every candidate Candidate Party Votes and share Share DemocraticJohn W JenretteWon Democratic 69,220100.0% - Votes for listed candidates
- 136,896
- Election day
- November 2, 1976
- District map
- Older district map (1972 to 1980)
US House, South Carolina District 6, 1976, every candidate Candidate Party Votes and share Share DemocraticJohn W Jenrette JrWon Democratic 75,91655.5% RepublicanEdward L Young Republican 60,28844.0% IndependentClarence C Dillingham Independent 6870.5% Scattered write-insName as filed: Writein Write-in 50.0%
1976 to 2024: MIT Election Data and Science Lab, U.S. House 1976-2024, retrieved Oct 28, 2026. Compiled by MIT Election Data and Science Lab (MEDSL) from official returns; not an official source
District numbers are reused after each redistricting, so rows on older lines cover different territory than today's South Carolina District 6.
Download and cite
Cite this page
Election Wrld. (2026). South Carolina District 6, US House results. https://www.electionwrld.com/sc/congress/6. Retrieved October 30, 2026.
Embed this seat
<iframe src="https://www.electionwrld.com/embed/sc/congress/6" title="South Carolina District 6, US House" width="100%" height="400" style="border:0;max-width:640px" loading="lazy"></iframe>
<p style="font-size:13px">Data: <a href="https://www.electionwrld.com">Election Wrld</a>, CC BY 4.0</p>Sources
Sources: MIT Election Data and Science Lab, U.S. House 1976-2024 (CC0 1.0), retrieved Oct 28, 2026, compiled by MIT Election Data and Science Lab (MEDSL) from official returns, not an official source; Census TIGERweb Legislative MapServer (120th CDs layer 0, 119th CDs layer 4, 2026 SLD upper layer 1 and lower layer 2) (US Census Bureau, public domain), retrieved Oct 28, 2026; unitedstates/congress-legislators (current) (CC0-1.0), retrieved Oct 28, 2026, compiled by the @unitedstates project volunteers (rosters from official congressional sources) from official returns, not an official source.
DataState data (JSON)Sources: MIT Election Data and Science Lab, U.S. House 1976-2024, FEC, DIME (ODC-BY), Portraits: unitedstates/images (public domain)Data as of Oct 28, 2026