

Kentucky District 6
Tue, Nov 3 · Seat held by Andy Barr Republican since Jan 2013
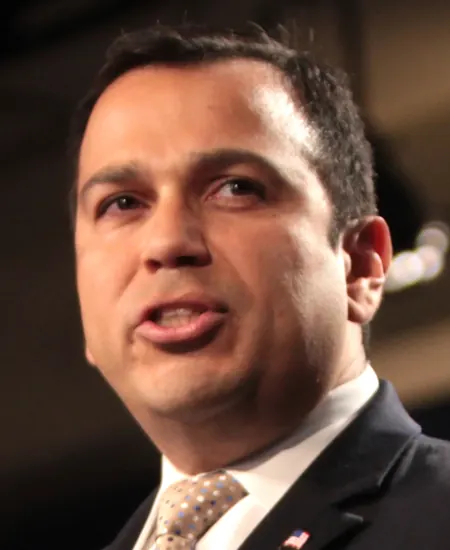
Ralph Alvarado 39.7Zach Dembo 46.7
Average of 3 polls, Sep 29 to Oct 20, from VoteHub · how it’s calculated
Newest poll
3 are partisan pollsNewest · Public Policy Polling, field dates Oct 19 to Oct 20, released Oct 21, 572 likely voters, partisan (D), per VoteHubPoll sponsored by House Majority PACPolls updated Oct 30, 7:30 p.m. ET, from VoteHub
Show all 4 candidates on the ballot
- Zach DemboDemocratic
- Ralph AlvaradoRepublican
- Jay J BowmanIndependentfiled
- Pete LynchOther(Kentucky Party)filed
Write-in candidates, not printed on the ballot
Showing major-party nominees, incumbents and candidates with 5%+ in the latest poll or comparable fundraising.
- Last election
- Andy Barr (Republican) won by 26.0 points, 2024
- Margin since 2022
- 3.1 points toward Democrats
- On the 2026 ballot
- 4 candidates
Polls over time
4 polls, through Election Day Nov 3The thick line is the 7-week average, not a forecast. How it’s calculated. All polls. Polls updated Oct 30, 7:30 p.m. ET, from VoteHub.
The polls in this chart (4)
1 poll released in the last 14 days · latest results range from 46 to 48% (D) and 38 to 45% (R) (newest 4 polls on the chart)
4 of the 4 polls for this race, each with both names, plotted on the field end date.
| Pollster | Field dates | Released | Sample | Dembo | Alvarado |
|---|---|---|---|---|---|
| Public Policy Polling | Oct 19 to Oct 20 | Oct 21 | 572 likely voters | 47 | 41 |
| Change Research | Sep 29 to Oct 5 | Oct 9 | 524 likely voters | 47 | 38 |
| Lake Research Partners | Sep 30 to Oct 4 | Oct 9 | 400 likely voters | 48 | 45 |
| Lake Research Partners | Sep 30 to Oct 4 | Oct 9 | 400 likely voters | 46 | 40 |
Side by side
Left column: AlvaradoRight column: Dembo
- Total receipts, 2025-2026 cycle, through Oct 14
- $2.3M
- $3.2M
- Cash on hand
- $181K
- $620K
- Age on Election Day
- 56
- Not available
Money: FEC bulk data, through Oct 14. One or more are matched to the FEC by name, party and seat, so a total could belong to someone else.
How these are counted
Total receipts line of each candidate’s principal campaign committee, 2025-2026 cycle. Other sites may show career, six-year or all-committee totals, which differ. Alvarado: $2,307,369 received, $180,812 cash on hand. Dembo: $3,205,462 received, $620,330 cash on hand.
More about this race
Candidates on the ballot
- Zach DemboDemocratic
- Ralph AlvaradoRepublican
- Jay J BowmanIndependentfiled
- Pete LynchOther(Kentucky Party)filed
Write-in candidates, not printed on the ballot
Some names come from filing lists and may not be on the ballot. This list may not include every candidate. See the official list at the Kentucky State Board of Elections
Source: web.sos.ky.gov, dated Oct 28
Shift since 2022: 3.1 points toward Democrats (Republican by 29.1 in 2022, Republican by 26.0 in 2024).
All Kentucky districts
- D 15+ pts
- D 5 to 15 pts
- D under 5 pts
- R under 5 pts
- R 5 to 15 pts
- R 15+ pts
- Other winner
- No data
Show these districts as a list (6)
- Kentucky District 1· James Comer (R), Republican by 49.4 points, 2024
- Kentucky District 2· Brett Guthrie (R), Republican by 46.2 points, 2024
- Kentucky District 3· Morgan McGarvey (D), Democratic by 23.9 points, 2024
- Kentucky District 4· Thomas Massie (R), Republican by 99.2 points, 2024
- Kentucky District 5· Harold Rogers (R), unopposed, 2024
- Kentucky District 6· Andy Barr (R), Republican by 26.0 points, 2024
Map settings
Vote in Kentucky
Trouble voting? Election Protection hotline: 866-OUR-VOTE. A nonpartisan coalition of civil-rights and voting-rights groups, not a government service. 866ourvote.org
History (25 elections for this seat)
- Votes for listed candidates
- 352,638
- Election day
- November 5, 2024
- District map
- Same as today
US House, Kentucky District 6, 2024, every candidate Candidate Party Votes and share Share RepublicanAndy BarrWon Republican 222,29363.0% DemocraticRandy Cravens Democratic 130,34537.0% - Votes for listed candidates
- 246,818
- Election day
- November 8, 2022
- District map
- Same as today
US House, Kentucky District 6, 2022, every candidate Candidate Party Votes and share Share RepublicanAndy BarrWon Republican 154,76262.7% DemocraticGeoffrey M "Geoff" Young Democratic 83,00533.6% OtherMaurice Randall Cravens II Other 8,9703.6% OtherMaxwell Keith Froedge Other 810.0% - Votes for listed candidates
- 378,450
- Election day
- November 3, 2020
- District map
- Older district map (2012 to 2020)
US House, Kentucky District 6, 2020, every candidate Candidate Party Votes and share Share RepublicanAndy BarrWon Republican 216,94857.3% DemocraticJosh Hicks Democratic 155,01141.0% LibertarianFrank Harris Libertarian 6,4911.7% - Votes for listed candidates
- 302,888
- Election day
- November 6, 2018
- District map
- Older district map (2012 to 2020)
US House, Kentucky District 6, 2018, every candidate Candidate Party Votes and share Share RepublicanAndy BarrWon Republican 154,46851.0% DemocraticAmy McGrath Democratic 144,73647.8% LibertarianFrank Harris Libertarian 2,1500.7% IndependentRikka L Wallin Independent 1,0110.3% IndependentJames Germalic Independent 5230.2% - Votes for listed candidates
- 330,827
- Election day
- November 8, 2016
- District map
- Older district map (2012 to 2020)
US House, Kentucky District 6, 2016, every candidate Candidate Party Votes and share Share RepublicanAndy BarrWon Republican 202,09961.1% DemocraticNancy Jo Kemper Democratic 128,72838.9% - Votes for listed candidates
- 245,694
- Election day
- November 4, 2014
- District map
- Older district map (2012 to 2020)
US House, Kentucky District 6, 2014, every candidate Candidate Party Votes and share Share RepublicanAndy BarrWon Republican 147,40460.0% DemocraticElizabeth Jensen Democratic 98,29040.0% - Votes for listed candidates
- 303,000
- Election day
- November 6, 2012
- District map
- Older district map (2012 to 2020)
US House, Kentucky District 6, 2012, every candidate Candidate Party Votes and share Share RepublicanAndy BarrWonName as filed: Garland "Andy" Barr Republican 153,22250.6% DemocraticBen Chandler Democratic 141,43846.7% Scattered write-insName as filed: Writein Write-in 8,3402.8% - Votes for listed candidates
- 239,223
- Election day
- November 2, 2010
- District map
- Older district map (2002 to 2010)
US House, Kentucky District 6, 2010, every candidate Candidate Party Votes and share Share DemocraticBen ChandlerWon Democratic 119,81250.1% RepublicanGarland "Andy" Barr Republican 119,16449.8% Scattered write-insName as filed: Writein Write-in 2250.1% OtherRandolp S Vance Other 220.0% - Votes for listed candidates
- 315,142
- Election day
- November 4, 2008
- District map
- Older district map (2002 to 2010)
US House, Kentucky District 6, 2008, every candidate Candidate Party Votes and share Share DemocraticBen ChandlerWon Democratic 203,76464.7% RepublicanJon Larson Republican 111,37835.3% - Votes for listed candidates
- 185,780
- Election day
- November 7, 2006
- District map
- Older district map (2002 to 2010)
US House, Kentucky District 6, 2006, every candidate Candidate Party Votes and share Share DemocraticBen ChandlerWon Democratic 158,76585.5% LibertarianPaul Ard Libertarian 27,01514.5% - Votes for listed candidates
- 299,217
- Election day
- November 2, 2004
- District map
- Older district map (2002 to 2010)
US House, Kentucky District 6, 2004, every candidate Candidate Party Votes and share Share DemocraticBen ChandlerWon Democratic 175,35558.6% RepublicanTom Buford Republican 119,71640.0% OtherStacy Abner Other 2,3880.8% LibertarianMark Gailey Libertarian 1,7580.6% - Votes for listed candidates
- 160,688
- Election day
- November 5, 2002
- District map
- Older district map (2002 to 2010)
US House, Kentucky District 6, 2002, every candidate Candidate Party Votes and share Share RepublicanErnie FletcherWon Republican 115,62272.0% IndependentGatewood Galbraith Independent 41,75326.0% LibertarianMark Gailey Libertarian 3,3132.1% - Votes for listed candidates
- 270,803
- Election day
- November 7, 2000
- District map
- Older district map (1992 to 2000)
US House, Kentucky District 6, 2000, every candidate Candidate Party Votes and share Share RepublicanErnie FletcherWon Republican 142,97152.8% DemocraticScotty Baesler Democratic 94,16734.8% OtherGatewood Galbraith Other 32,43612.0% LibertarianJoseph Novak Libertarian 1,2290.5% - Votes for listed candidates
- 195,918
- Election day
- November 3, 1998
- District map
- Older district map (1992 to 2000)
US House, Kentucky District 6, 1998, every candidate Candidate Party Votes and share Share RepublicanErnie FletcherWon Republican 104,04653.1% DemocraticErnesto Scorsone Democratic 90,03346.0% OtherWasley S Krogdahl Other 1,8390.9% - Votes for listed candidates
- 226,230
- Election day
- November 5, 1996
- District map
- Older district map (1992 to 2000)
US House, Kentucky District 6, 1996, every candidate Candidate Party Votes and share Share DemocraticScotty BaeslerWon Democratic 125,99955.7% RepublicanErnest Fletcher Republican 100,23144.3% - Votes for listed candidates
- 119,117
- Election day
- November 8, 1994
- District map
- Older district map (1992 to 2000)
US House, Kentucky District 6, 1994, every candidate Candidate Party Votes and share Share DemocraticScotty BaeslerWon Democratic 70,08558.8% RepublicanMatthew Eric Wills Republican 49,03241.2% - Votes for listed candidates
- 223,450
- Election day
- November 3, 1992
- District map
- Older district map (1992 to 2000)
US House, Kentucky District 6, 1992, every candidate Candidate Party Votes and share Share DemocraticScotty BaeslerWon Democratic 135,61360.7% RepublicanCharles W Ellinger Republican 87,81639.3% Scattered write-insName as filed: Writein Write-in 210.0% - Votes for listed candidates
- 76,859
- Election day
- November 6, 1990
- District map
- Older district map (1982 to 1990)
US House, Kentucky District 6, 1990, every candidate Candidate Party Votes and share Share RepublicanLarry J HopkinsWon Republican 76,859100.0% - Votes for listed candidates
- 174,277
- Election day
- November 8, 1988
- District map
- Older district map (1982 to 1990)
US House, Kentucky District 6, 1988, every candidate Candidate Party Votes and share Share RepublicanLarry J HopkinsWon Republican 128,89874.0% DemocraticMilton Patton Democratic 45,33926.0% Scattered write-insName as filed: Writein Write-in 400.0% - Votes for listed candidates
- 102,224
- Election day
- November 4, 1986
- District map
- Older district map (1982 to 1990)
US House, Kentucky District 6, 1986, every candidate Candidate Party Votes and share Share RepublicanLarry J HopkinsWon Republican 75,90674.3% DemocraticJerry W Hammons Democratic 26,31525.7% Scattered write-insName as filed: Writein Write-in 30.0% - Votes for listed candidates
- 177,108
- Election day
- November 6, 1984
- District map
- Older district map (1982 to 1990)
US House, Kentucky District 6, 1984, every candidate Candidate Party Votes and share Share RepublicanLarry J HopkinsWon Republican 126,52571.4% DemocraticJerry Hammond Democratic 49,65728.0% LibertarianTom Suruda Libertarian 9260.5% - Votes for listed candidates
- 120,360
- Election day
- November 2, 1982
- District map
- Older district map (1982 to 1990)
US House, Kentucky District 6, 1982, every candidate Candidate Party Votes and share Share RepublicanLarry J HopkinsWon Republican 68,41856.8% DemocraticDon Mills Democratic 49,83941.4% LibertarianKen Ashby Libertarian 1,1851.0% IndependentDon B Pratt Independent 9170.8% Scattered write-insName as filed: Writein Write-in 10.0% - Votes for listed candidates
- 179,051
- Election day
- November 4, 1980
- District map
- Older district map (1972 to 1980)
US House, Kentucky District 6, 1980, every candidate Candidate Party Votes and share Share RepublicanLarry J HopkinsWon Republican 105,37658.9% DemocraticTom Easterly Democratic 72,47340.5% IndependentDon Bertram Pratt Independent 1,2020.7% - Votes for listed candidates
- 102,857
- Election day
- November 7, 1978
- District map
- Older district map (1972 to 1980)
US House, Kentucky District 6, 1978, every candidate Candidate Party Votes and share Share RepublicanLarry J HopkinsWon Republican 52,09250.6% DemocraticCharles T Easterly Democratic 47,43646.1% OtherLloyd K Rogers Other 3,3233.2% Scattered write-insName as filed: Writein Write-in 60.0% - Votes for listed candidates
- 96,493
- Election day
- November 2, 1976
- District map
- Older district map (1972 to 1980)
US House, Kentucky District 6, 1976, every candidate Candidate Party Votes and share Share DemocraticJohn B BreckinridgeWon Democratic 90,69594.0% OtherAnthony A McCord Other 5,7956.0% Scattered write-insName as filed: Writein Write-in 30.0%
1976 to 2024: MIT Election Data and Science Lab, U.S. House 1976-2024, retrieved Oct 28, 2026. Compiled by MIT Election Data and Science Lab (MEDSL) from official returns; not an official source
District numbers are reused after each redistricting, so rows on older lines cover different territory than today's Kentucky District 6.
Download and cite
Cite this page
Election Wrld. (2026). Kentucky District 6, US House results. https://www.electionwrld.com/ky/congress/6. Retrieved October 30, 2026.
Embed this seat
<iframe src="https://www.electionwrld.com/embed/ky/congress/6" title="Kentucky District 6, US House" width="100%" height="400" style="border:0;max-width:640px" loading="lazy"></iframe>
<p style="font-size:13px">Data: <a href="https://www.electionwrld.com">Election Wrld</a>, CC BY 4.0</p>Sources
Sources: MIT Election Data and Science Lab, U.S. House 1976-2024 (CC0 1.0), retrieved Oct 28, 2026, compiled by MIT Election Data and Science Lab (MEDSL) from official returns, not an official source; Census TIGERweb Legislative MapServer (120th CDs layer 0, 119th CDs layer 4, 2026 SLD upper layer 1 and lower layer 2) (US Census Bureau, public domain), retrieved Oct 28, 2026; unitedstates/congress-legislators (current) (CC0-1.0), retrieved Oct 28, 2026, compiled by the @unitedstates project volunteers (rosters from official congressional sources) from official returns, not an official source.
DataState data (JSON)Sources: MIT Election Data and Science Lab, U.S. House 1976-2024, VoteHub polls (CC BY 4.0), FEC, Photo creditsData as of Oct 30, 2026 (candidate list Oct 28, 2026)