

New Jersey District 11
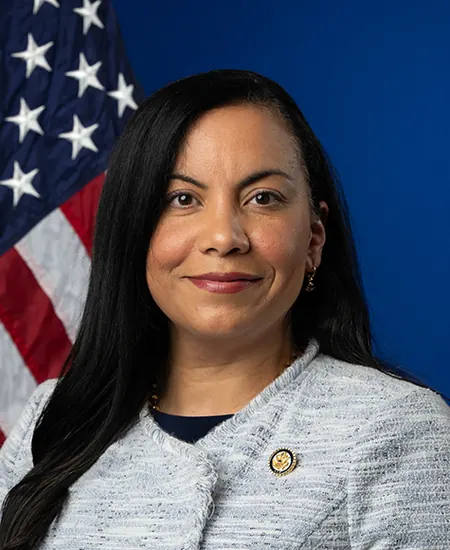
Tue, Nov 3 · Seat held by Analilia Mejia Democratic since Apr 2026
No published poll names both candidates.Seat changed hands after 2024. That result isn't on file yet.
Show all 3 candidates on the ballot
- Analilia MejiaIncumbentDemocratic
- Joe HathawayRepublican
- Alan B. BondIndependentHope For Tomorrow
Showing major-party nominees, incumbents and candidates with 5%+ in the latest poll or comparable fundraising.
- Last election
- Mikie Sherrill (Democratic) won by 14.7 points, 2024
- Margin since 2022
- 4.1 points toward Republicans
- On the 2026 ballot
- 3 candidates
Side by side
Left column: HathawayRight column: Mejia
- Total receipts, 2025-2026 cycle, through Oct 14
- $838K
- $2.2M
- Cash on hand
- $42K
- $115K
- Years since first win on file
- Not available
- 0
- Age on Election Day
- Not available
- 49
Money: FEC bulk data, through Oct 14. One or more are matched to the FEC by name, party and seat, so a total could belong to someone else.
How these are counted
Total receipts line of each candidate’s principal campaign committee, 2025-2026 cycle. Other sites may show career, six-year or all-committee totals, which differ. Hathaway: $837,601 received, $42,173 cash on hand. Mejia: $2,229,339 received, $115,467 cash on hand.
More about this race
Candidates on the ballot
- Analilia MejiaIncumbentDemocratic
- Joe HathawayRepublican
- Alan B. BondIndependentHope For Tomorrow
Source: nj.gov (PDF), dated Sep 4
Shift since 2022: 4.1 points toward Republicans (Democratic by 18.8 in 2022, Democratic by 14.7 in 2024).
All New Jersey districts
- D 15+ pts
- D 5 to 15 pts
- D under 5 pts
- R under 5 pts
- R 5 to 15 pts
- R 15+ pts
- Other winner
- No data
Show these districts as a list (12)
- New Jersey District 1· Donald Norcross (D), Democratic by 17.8 points, 2024
- New Jersey District 2· Jefferson Van Drew (R), Republican by 16.9 points, 2024
- New Jersey District 3· Herbert C. Conaway, Jr. (D), Democratic by 8.5 points, 2024
- New Jersey District 4· Christopher H. Smith (R), Republican by 35.7 points, 2024
- New Jersey District 5· Josh Gottheimer (D), Democratic by 11.3 points, 2024
- New Jersey District 6· Frank Pallone, Jr. (D), Democratic by 15.8 points, 2024
- New Jersey District 7· Thomas H. Kean, Jr. (R), Republican by 5.4 points, 2024
- New Jersey District 8· Robert Menendez (D), Democratic by 24.6 points, 2024
- New Jersey District 9· Nellie Pou (D), Democratic by 4.9 points, 2024
- New Jersey District 10· LaMonica McIver (D), Democratic by 52.2 points, 2024
- New Jersey District 11· Mikie Sherrill (D), Democratic by 14.7 points, 2024
- New Jersey District 12· Bonnie Watson Coleman (D), Democratic by 24.8 points, 2024
Map settings
Vote in New Jersey
Trouble voting? Election Protection hotline: 866-OUR-VOTE. A nonpartisan coalition of civil-rights and voting-rights groups, not a government service. 866ourvote.org
Official results for New Jersey
History (25 elections for this seat)
- Votes for listed candidates
- 393,751
- Election day
- November 5, 2024
- District map
- Same as today
US House, New Jersey District 11, 2024, every candidate Candidate Party Votes and share Share DemocraticMikie SherrillWon Democratic 222,58356.5% RepublicanJoseph Belnome Republican 164,55641.8% GreenLily Benavides Green 4,7801.2% OtherJoshua Lanzara Other 1,8320.5% - Votes for listed candidates
- 273,664
- Election day
- November 8, 2022
- District map
- Same as today
US House, New Jersey District 11, 2022, every candidate Candidate Party Votes and share Share DemocraticMikie SherrillWon Democratic 161,43659.0% RepublicanPaul DeGroot Republican 109,95240.2% LibertarianJoseph Biasco Libertarian 2,2760.8% - Votes for listed candidates
- 441,176
- Election day
- November 3, 2020
- District map
- Older district map (2012 to 2020)
US House, New Jersey District 11, 2020, every candidate Candidate Party Votes and share Share DemocraticMikie SherrillWon Democratic 235,16353.3% RepublicanRosemary Becchi Republican 206,01346.7% - Votes for listed candidates
- 323,574
- Election day
- November 6, 2018
- District map
- Older district map (2012 to 2020)
US House, New Jersey District 11, 2018, every candidate Candidate Party Votes and share Share DemocraticMikie SherrillWon Democratic 183,68456.8% RepublicanJay Webber Republican 136,32242.1% OtherRobert F Crook Other 2,1820.7% LibertarianRyan Martinez Libertarian 1,3860.4% - Votes for listed candidates
- 334,992
- Election day
- November 8, 2016
- District map
- Older district map (2012 to 2020)
US House, New Jersey District 11, 2016, every candidate Candidate Party Votes and share Share RepublicanRodney P FrelinghuysenWon Republican 194,29958.0% DemocraticJoseph M Wenzel Democratic 130,16238.9% OtherThomas Depasquale Other 7,0562.1% LibertarianJeff Hetrick Libertarian 3,4751.0% - Votes for listed candidates
- 174,932
- Election day
- November 4, 2014
- District map
- Older district map (2012 to 2020)
US House, New Jersey District 11, 2014, every candidate Candidate Party Votes and share Share RepublicanRodney P FrelinghuysenWon Republican 109,45562.6% DemocraticMark Dunec Democratic 65,47737.4% - Votes for listed candidates
- 309,859
- Election day
- November 6, 2012
- District map
- Older district map (2012 to 2020)
US House, New Jersey District 11, 2012, every candidate Candidate Party Votes and share Share RepublicanRodney P FrelinghuysenWon Republican 182,23758.8% DemocraticJohn Arvanites Democratic 123,89740.0% OtherBarry Berlin Other 3,7251.2% - Votes for listed candidates
- 181,800
- Election day
- November 2, 2010
- District map
- Older district map (2002 to 2010)
US House, New Jersey District 11, 2010, every candidate Candidate Party Votes and share Share RepublicanRodney P FrelinghuysenWon Republican 122,14967.2% DemocraticDouglas Herbert Democratic 55,47230.5% LibertarianJim Gawron Libertarian 4,1792.3% - Votes for listed candidates
- 306,732
- Election day
- November 4, 2008
- District map
- Older district map (2002 to 2010)
US House, New Jersey District 11, 2008, every candidate Candidate Party Votes and share Share RepublicanRodney P FrelinghuysenWon Republican 189,69661.8% DemocraticTom Wyka Democratic 113,51037.0% OtherChandler Tedholm Other 3,5261.1% - Votes for listed candidates
- 203,071
- Election day
- November 7, 2006
- District map
- Older district map (2002 to 2010)
US House, New Jersey District 11, 2006, every candidate Candidate Party Votes and share Share RepublicanRodney P FrelinghuysenWon Republican 126,08562.1% DemocraticTom Wyka Democratic 74,41436.6% LibertarianRichard S Roth Libertarian 1,7300.9% OtherJohn Mele Other 8420.4% - Votes for listed candidates
- 296,002
- Election day
- November 2, 2004
- District map
- Older district map (2002 to 2010)
US House, New Jersey District 11, 2004, every candidate Candidate Party Votes and share Share RepublicanRodney P FrelinghuysenWon Republican 200,91567.9% DemocraticJames W Buell Democratic 91,81131.0% IndependentJohn Mele Independent 1,7460.6% IndependentAustin S Lett Independent 1,5300.5% - Votes for listed candidates
- 183,678
- Election day
- November 5, 2002
- District map
- Older district map (2002 to 2010)
US House, New Jersey District 11, 2002, every candidate Candidate Party Votes and share Share RepublicanRodney P FrelinghuysenWon Republican 132,93872.4% DemocraticVij Pawar Democratic 48,47726.4% LibertarianRichard S Roth Libertarian 2,2631.2% - Votes for listed candidates
- 273,838
- Election day
- November 7, 2000
- District map
- Older district map (1992 to 2000)
US House, New Jersey District 11, 2000, every candidate Candidate Party Votes and share Share RepublicanRodney P FrelinghuysenWon Republican 186,14068.0% DemocraticJohn P Scollo Democratic 80,95829.6% IndependentJohn Pickarski Independent 5,1991.9% IndependentJames E Spinosa Independent 1,5410.6% - Votes for listed candidates
- 148,971
- Election day
- November 3, 1998
- District map
- Older district map (1992 to 2000)
US House, New Jersey District 11, 1998, every candidate Candidate Party Votes and share Share RepublicanRodney P FrelinghuysenWon Republican 100,91067.7% DemocraticJohn P Scollo Democratic 44,16029.6% IndependentAustin S Lett Independent 1,7371.2% IndependentAgnes A James Independent 1,4090.9% IndependentStephen A Bauer Independent 7550.5% - Votes for listed candidates
- 255,158
- Election day
- November 5, 1996
- District map
- Older district map (1992 to 2000)
US House, New Jersey District 11, 1996, every candidate Candidate Party Votes and share Share RepublicanRodney P FrelinghuysenWon Republican 169,09166.3% DemocraticChris Evangel Democratic 78,74230.9% IndependentEd Demott Independent 2,8701.1% IndependentAustin S Lett Independent 2,6181.0% IndependentVictoria S Spruiell Independent 1,8370.7% - Votes for listed candidates
- 179,580
- Election day
- November 8, 1994
- District map
- Older district map (1992 to 2000)
US House, New Jersey District 11, 1994, every candidate Candidate Party Votes and share Share RepublicanRodney P FrelinghuysenWon Republican 127,86871.2% DemocraticFrank Herbet Democratic 50,21128.0% OtherMary Freuholz Other 1,0650.6% OtherStuart Bacha Other 4360.2% - Votes for listed candidates
- 268,436
- Election day
- November 3, 1992
- District map
- Older district map (1992 to 2000)
US House, New Jersey District 11, 1992, every candidate Candidate Party Votes and share Share RepublicanDean A GalloWon Republican 188,16570.1% DemocraticOna Spiridellis Democratic 68,87125.7% LibertarianRichard S Roth Libertarian 3,5381.3% OtherBarry J Fitzpatrick Other 3,1271.2% IndependentDavid C Karlen Independent 1,8820.7% IndependentHoward Safier Independent 1,7110.6% OtherRichard E Hrazanek Other 1,1420.4% - Votes for listed candidates
- 143,686
- Election day
- November 6, 1990
- District map
- Older district map (1982 to 1990)
US House, New Jersey District 11, 1990, every candidate Candidate Party Votes and share Share RepublicanDean A GalloWon Republican 92,68164.5% DemocraticMichael Gordon Democratic 47,41433.0% OtherJasper "Jack" Gould Other 3,5912.5% - Votes for listed candidates
- 219,427
- Election day
- November 8, 1988
- District map
- Older district map (1982 to 1990)
US House, New Jersey District 11, 1988, every candidate Candidate Party Votes and share Share RepublicanDean A GalloWon Republican 154,65470.5% DemocraticJohn C Shaw Democratic 64,77329.5% - Votes for listed candidates
- 110,317
- Election day
- November 4, 1986
- District map
- Older district map (1982 to 1990)
US House, New Jersey District 11, 1986, every candidate Candidate Party Votes and share Share RepublicanDean A GalloWon Republican 75,03768.0% DemocraticFrank Askin Democratic 35,28032.0% - Votes for listed candidates
- 239,700
- Election day
- November 6, 1984
- District map
- Older district map (1982 to 1990)
US House, New Jersey District 11, 1984, every candidate Candidate Party Votes and share Share RepublicanDean A GalloWon Republican 133,66255.8% DemocraticJoseph G Minish Democratic 106,03844.2% - Votes for listed candidates
- 164,237
- Election day
- November 2, 1982
- District map
- Older district map (1982 to 1990)
US House, New Jersey District 11, 1982, every candidate Candidate Party Votes and share Share DemocraticJoseph G MinishWon Democratic 105,60764.3% RepublicanRey Redington Republican 57,09934.8% LibertarianRichard S Roth Libertarian 1,5310.9% - Votes for listed candidates
- 168,524
- Election day
- November 4, 1980
- District map
- Older district map (1972 to 1980)
US House, New Jersey District 11, 1980, every candidate Candidate Party Votes and share Share DemocraticJoseph G MinishWon Democratic 106,15563.0% RepublicanRobert A Davis Republican 57,77234.3% OtherJon Britton Other 1,6501.0% OtherRobert G Trugman Other 1,6301.0% LibertarianRichard S Roth Libertarian 1,3170.8% - Votes for listed candidates
- 125,174
- Election day
- November 7, 1978
- District map
- Older district map (1972 to 1980)
US House, New Jersey District 11, 1978, every candidate Candidate Party Votes and share Share DemocraticJoseph G MinishWon Democratic 88,29470.5% RepublicanJulius George Feld Republican 35,64228.5% LibertarianRichard S Roth Libertarian 1,2381.0% - Votes for listed candidates
- 190,808
- Election day
- November 2, 1976
- District map
- Older district map (1972 to 1980)
US House, New Jersey District 11, 1976, every candidate Candidate Party Votes and share Share DemocraticJoseph G MinishWon Democratic 129,02667.6% RepublicanCharles A Pockel Jr Republican 59,39731.1% LibertarianWarren T Kupchik Libertarian 1,7490.9% OtherJoseph A Rogers Other 6360.3%
1976 to 2024: MIT Election Data and Science Lab, U.S. House 1976-2024, retrieved Oct 28, 2026. Compiled by MIT Election Data and Science Lab (MEDSL) from official returns; not an official source
District numbers are reused after each redistricting, so rows on older lines cover different territory than today's New Jersey District 11.
Download and cite
Cite this page
Election Wrld. (2026). New Jersey District 11, US House results. https://www.electionwrld.com/nj/congress/11. Retrieved October 30, 2026.
Embed this seat
<iframe src="https://www.electionwrld.com/embed/nj/congress/11" title="New Jersey District 11, US House" width="100%" height="400" style="border:0;max-width:640px" loading="lazy"></iframe>
<p style="font-size:13px">Data: <a href="https://www.electionwrld.com">Election Wrld</a>, CC BY 4.0</p>Sources
Sources: MIT Election Data and Science Lab, U.S. House 1976-2024 (CC0 1.0), retrieved Oct 28, 2026, compiled by MIT Election Data and Science Lab (MEDSL) from official returns, not an official source; Census TIGERweb Legislative MapServer (120th CDs layer 0, 119th CDs layer 4, 2026 SLD upper layer 1 and lower layer 2) (US Census Bureau, public domain), retrieved Oct 28, 2026; unitedstates/congress-legislators (current) (CC0-1.0), retrieved Oct 28, 2026, compiled by the @unitedstates project volunteers (rosters from official congressional sources) from official returns, not an official source.
DataState data (JSON)Sources: MIT Election Data and Science Lab, U.S. House 1976-2024, FEC, Photo creditsData as of Oct 28, 2026