

New Jersey District 5
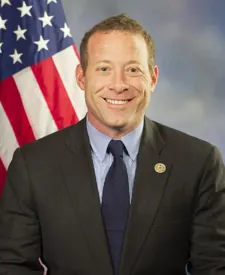
Tue, Nov 3 · Seat held by Josh Gottheimer Democratic since Jan 2017
No published poll names both candidates.Last result · 2024 general: Josh Gottheimer (D) 54.6, Mary Jo Guinchard (R) 43.3, Beau Forte (G) 0.9
Show all 3 candidates on the ballot
- Josh GottheimerIncumbentDemocratic
- Sean KirraneRepublican
- Adam RuedaIndependentHumane Sustainable Future
Showing major-party nominees, incumbents and candidates with 5%+ in the latest poll or comparable fundraising.
- Last election
- Josh Gottheimer (Democratic) won by 11.3 points, 2024
- Margin since 2022
- 0.9 points toward Democrats
- On the 2026 ballot
- 3 candidates
Side by side
Left column: GottheimerRight column: Kirrane
- Total receipts, 2025-2026 cycle, through Oct 14
- $5.8M
- $104K
- Cash on hand
- $13.5M
- $196
- Donor-based spectrum
- LiberalCentristConservativeGottheimerNo published score for Kirrane
- Races
- Won 5 of 5
- None listed
- Years since first win
- 9
- Not available
- Age on Election Day
- 51
- Not available
Money: FEC bulk data, through Oct 14. One or more are matched to the FEC by name, party and seat, so a total could belong to someone else.
How these are counted
Total receipts line of each candidate’s principal campaign committee, 2025-2026 cycle. Other sites may show career, six-year or all-committee totals, which differ. Gottheimer: $5,788,812 received, $13,531,047 cash on hand. Kirrane: $103,742 received, $196 cash on hand. The spectrum is a published research score, not our rating. How this works. Wins and losses count the races in our results files, the same as each profile.
More about this race
Candidates on the ballot
- Josh GottheimerIncumbentDemocratic
- Sean KirraneRepublican
- Adam RuedaIndependentHumane Sustainable Future
Source: nj.gov (PDF), dated Sep 4
Shift since 2022: 0.9 points toward Democrats (Democratic by 10.4 in 2022, Democratic by 11.3 in 2024).
All New Jersey districts
- D 15+ pts
- D 5 to 15 pts
- D under 5 pts
- R under 5 pts
- R 5 to 15 pts
- R 15+ pts
- Other winner
- No data
Show these districts as a list (12)
- New Jersey District 1· Donald Norcross (D), Democratic by 17.8 points, 2024
- New Jersey District 2· Jefferson Van Drew (R), Republican by 16.9 points, 2024
- New Jersey District 3· Herbert C. Conaway, Jr. (D), Democratic by 8.5 points, 2024
- New Jersey District 4· Christopher H. Smith (R), Republican by 35.7 points, 2024
- New Jersey District 5· Josh Gottheimer (D), Democratic by 11.3 points, 2024
- New Jersey District 6· Frank Pallone, Jr. (D), Democratic by 15.8 points, 2024
- New Jersey District 7· Thomas H. Kean, Jr. (R), Republican by 5.4 points, 2024
- New Jersey District 8· Robert Menendez (D), Democratic by 24.6 points, 2024
- New Jersey District 9· Nellie Pou (D), Democratic by 4.9 points, 2024
- New Jersey District 10· LaMonica McIver (D), Democratic by 52.2 points, 2024
- New Jersey District 11· Mikie Sherrill (D), Democratic by 14.7 points, 2024
- New Jersey District 12· Bonnie Watson Coleman (D), Democratic by 24.8 points, 2024
Map settings
Vote in New Jersey
Trouble voting? Election Protection hotline: 866-OUR-VOTE. A nonpartisan coalition of civil-rights and voting-rights groups, not a government service. 866ourvote.org
Official results for New Jersey
History (25 elections for this seat)
- Votes for listed candidates
- 381,889
- Election day
- November 5, 2024
- District map
- Same as today
US House, New Jersey District 5, 2024, every candidate Candidate Party Votes and share Share DemocraticJosh GottheimerWon Democratic 208,35954.6% RepublicanMary Jo Guinchard Republican 165,28743.3% GreenBeau Forte Green 3,4280.9% LibertarianJames Tosone Libertarian 2,4400.6% OtherAamir Arif Other 2,3750.6% - Votes for listed candidates
- 265,943
- Election day
- November 8, 2022
- District map
- Same as today
US House, New Jersey District 5, 2022, every candidate Candidate Party Votes and share Share DemocraticJosh GottheimerWon Democratic 145,55954.7% RepublicanFrank T Pallotta Republican 117,87344.3% LibertarianJeremy Marcus Libertarian 1,1930.4% OtherTrevor James Ferrigno Other 7000.3% OtherLouis Vellucci Other 6180.2% - Votes for listed candidates
- 423,636
- Election day
- November 3, 2020
- District map
- Older district map (2012 to 2020)
US House, New Jersey District 5, 2020, every candidate Candidate Party Votes and share Share DemocraticJosh GottheimerWon Democratic 225,17553.2% RepublicanFrank T Pallotta Republican 193,33345.6% OtherLouis A Vellucci Other 5,1281.2% - Votes for listed candidates
- 301,823
- Election day
- November 6, 2018
- District map
- Older district map (2012 to 2020)
US House, New Jersey District 5, 2018, every candidate Candidate Party Votes and share Share DemocraticJosh GottheimerWon Democratic 169,54656.2% RepublicanJohn J McCann Jr Republican 128,25542.5% LibertarianJames Tosone Libertarian 2,1150.7% OtherWendy W Goetz Other 1,9070.6% - Votes for listed candidates
- 337,701
- Election day
- November 8, 2016
- District map
- Older district map (2012 to 2020)
US House, New Jersey District 5, 2016, every candidate Candidate Party Votes and share Share DemocraticJosh GottheimerWonName as filed: Joshua S Gottheimer Democratic 172,58751.1% RepublicanScott Garrett Republican 157,69046.7% LibertarianClaudio Belusic Libertarian 7,4242.2% - Votes for listed candidates
- 188,921
- Election day
- November 4, 2014
- District map
- Older district map (2012 to 2020)
US House, New Jersey District 5, 2014, every candidate Candidate Party Votes and share Share RepublicanScott GarrettWon Republican 104,67855.4% DemocraticRoy Cho Democratic 81,80843.3% OtherMark D Quick Other 2,4351.3% - Votes for listed candidates
- 304,371
- Election day
- November 6, 2012
- District map
- Older district map (2012 to 2020)
US House, New Jersey District 5, 2012, every candidate Candidate Party Votes and share Share RepublicanScott GarrettWon Republican 167,50155.0% DemocraticAdam Gussen Democratic 130,10042.7% GreenPatricia Alessandrini Green 6,7702.2% - Votes for listed candidates
- 190,993
- Election day
- November 2, 2010
- District map
- Older district map (2002 to 2010)
US House, New Jersey District 5, 2010, every candidate Candidate Party Votes and share Share RepublicanScott GarrettWon Republican 124,03064.9% DemocraticTod Theise Democratic 62,63432.8% GreenEd Fanning Green 2,3471.2% OtherMark D Quick Other 1,6460.9% OtherJames Douglas Radigan Other 3360.2% - Votes for listed candidates
- 309,007
- Election day
- November 4, 2008
- District map
- Older district map (2002 to 2010)
US House, New Jersey District 5, 2008, every candidate Candidate Party Votes and share Share RepublicanScott GarrettWon Republican 172,65355.9% DemocraticDennis Shulman Democratic 131,03342.4% GreenEd Fanning Green 5,3211.7% - Votes for listed candidates
- 204,242
- Election day
- November 7, 2006
- District map
- Older district map (2002 to 2010)
US House, New Jersey District 5, 2006, every candidate Candidate Party Votes and share Share RepublicanScott GarrettWon Republican 112,14254.9% DemocraticPaul Aronsohn Democratic 89,50343.8% OtherR Matthew Fretz Other 2,5971.3% - Votes for listed candidates
- 297,425
- Election day
- November 2, 2004
- District map
- Older district map (2002 to 2010)
US House, New Jersey District 5, 2004, every candidate Candidate Party Votes and share Share RepublicanScott GarrettWon Republican 171,22057.6% DemocraticDorothea Anne Wolfe Democratic 122,25941.1% IndependentVictor Kaplan Independent 1,8570.6% IndependentThomas A Phelan Independent 1,5150.5% IndependentGregory Pason Independent 5740.2% - Votes for listed candidates
- 199,851
- Election day
- November 5, 2002
- District map
- Older district map (2002 to 2010)
US House, New Jersey District 5, 2002, every candidate Candidate Party Votes and share Share RepublicanScott GarrettWon Republican 118,88159.5% DemocraticAnne Sumers Democratic 76,50438.3% OtherMichael J Cino Other 4,4662.2% - Votes for listed candidates
- 268,524
- Election day
- November 7, 2000
- District map
- Older district map (1992 to 2000)
US House, New Jersey District 5, 2000, every candidate Candidate Party Votes and share Share RepublicanMarge RoukemaWon Republican 175,54665.4% DemocraticLinda A Mercurio Democratic 81,71530.4% IndependentMichael "MJ" King Independent 5,3292.0% IndependentRobert J McCafferty Independent 4,0951.5% IndependentIra W Goodman Independent 1,3580.5% IndependentHelen Hamilton Independent 4810.2% - Votes for listed candidates
- 166,818
- Election day
- November 3, 1998
- District map
- Older district map (1992 to 2000)
US House, New Jersey District 5, 1998, every candidate Candidate Party Votes and share Share RepublicanMarge RoukemaWon Republican 106,30463.7% DemocraticMike Scheider Democratic 55,48733.3% IndependentThomas W Wright Independent 2,3951.4% IndependentWilliam Weightman Independent 1,6281.0% IndependentHelen Hamilton Independent 1,0040.6% - Votes for listed candidates
- 254,333
- Election day
- November 5, 1996
- District map
- Older district map (1992 to 2000)
US House, New Jersey District 5, 1996, every candidate Candidate Party Votes and share Share RepublicanMarge RoukemaWon Republican 181,32371.3% DemocraticBill Auer Democratic 62,95624.8% IndependentLorraine L Laneve Independent 4,0931.6% IndependentDan Karlan Independent 2,1180.8% IndependentHelen Hamilton Independent 1,6780.7% IndependentBarry Childers Independent 1,2660.5% IndependentE Gregory Kresge Independent 8990.4% - Votes for listed candidates
- 188,505
- Election day
- November 8, 1994
- District map
- Older district map (1992 to 2000)
US House, New Jersey District 5, 1994, every candidate Candidate Party Votes and share Share RepublicanMarge RoukemaWon Republican 139,96474.2% DemocraticBill Auer Democratic 41,27521.9% IndependentWilliam J Leonard Independent 3,7462.0% LibertarianRoger Bacon Libertarian 2,8821.5% OtherHelen Hamilton Other 6380.3% - Votes for listed candidates
- 274,371
- Election day
- November 3, 1992
- District map
- Older district map (1992 to 2000)
US House, New Jersey District 5, 1992, every candidate Candidate Party Votes and share Share RepublicanMarge RoukemaWon Republican 196,19871.5% DemocraticFrank R Lucas Democratic 67,57924.6% IndependentWilliam J Leonard Independent 6,1822.3% LibertarianMichael V Pierone Libertarian 2,6361.0% OtherGeorge LaHood Other 9940.4% OtherStuart Bacha Other 7820.3% - Votes for listed candidates
- 156,109
- Election day
- November 6, 1990
- District map
- Older district map (1982 to 1990)
US House, New Jersey District 5, 1990, every candidate Candidate Party Votes and share Share RepublicanMarge RoukemaWon Republican 118,10175.7% DemocraticLawrence Wayne Olsen Democratic 35,01022.4% OtherMark Richards Other 2,9981.9% - Votes for listed candidates
- 231,936
- Election day
- November 8, 1988
- District map
- Older district map (1982 to 1990)
US House, New Jersey District 5, 1988, every candidate Candidate Party Votes and share Share RepublicanMarge RoukemaWon Republican 175,56275.7% DemocraticLee Monaco Democratic 54,82823.6% LibertarianDaniel M Karlan Libertarian 1,5460.7% - Votes for listed candidates
- 126,398
- Election day
- November 4, 1986
- District map
- Older district map (1982 to 1990)
US House, New Jersey District 5, 1986, every candidate Candidate Party Votes and share Share RepublicanMarge RoukemaWon Republican 85,94968.0% DemocraticH Vernon Jolley Democratic 40,44932.0% - Votes for listed candidates
- 241,645
- Election day
- November 6, 1984
- District map
- Older district map (1982 to 1990)
US House, New Jersey District 5, 1984, every candidate Candidate Party Votes and share Share RepublicanMarge RoukemaWon Republican 171,97971.2% DemocraticRose Brunetto Democratic 69,66628.8% - Votes for listed candidates
- 160,358
- Election day
- November 2, 1982
- District map
- Older district map (1982 to 1990)
US House, New Jersey District 5, 1982, every candidate Candidate Party Votes and share Share RepublicanMarge RoukemaWon Republican 104,69565.3% DemocraticFritz Cammerzell Democratic 53,65933.5% LibertarianWilliam J Zelko Jr Libertarian 2,0041.2% - Votes for listed candidates
- 201,299
- Election day
- November 4, 1980
- District map
- Older district map (1972 to 1980)
US House, New Jersey District 5, 1980, every candidate Candidate Party Votes and share Share RepublicanMillicent FenwickWon Republican 156,01677.5% DemocraticKieran E Pillion Jr Democratic 41,26920.5% LibertarianCarl R Samson Libertarian 2,4651.2% OtherJasper C Gould Other 1,5490.8% - Votes for listed candidates
- 138,847
- Election day
- November 7, 1978
- District map
- Older district map (1972 to 1980)
US House, New Jersey District 5, 1978, every candidate Candidate Party Votes and share Share RepublicanMillicent H FenwickWon Republican 100,73972.6% DemocraticJohn T Fahy Democratic 38,10827.4% - Votes for listed candidates
- 206,106
- Election day
- November 2, 1976
- District map
- Older district map (1972 to 1980)
US House, New Jersey District 5, 1976, every candidate Candidate Party Votes and share Share RepublicanMillicent II FenwickWon Republican 137,80366.9% DemocraticFrank R Nero Democratic 64,59831.3% LibertarianJane T Rehmke Libertarian 1,7230.8% OtherJohn Giammarco Other 1,4830.7% OtherJoseph R Viola Jr Other 4990.2%
1976 to 2024: MIT Election Data and Science Lab, U.S. House 1976-2024, retrieved Oct 28, 2026. Compiled by MIT Election Data and Science Lab (MEDSL) from official returns; not an official source
District numbers are reused after each redistricting, so rows on older lines cover different territory than today's New Jersey District 5.
Download and cite
Cite this page
Election Wrld. (2026). New Jersey District 5, US House results. https://www.electionwrld.com/nj/congress/5. Retrieved October 30, 2026.
Embed this seat
<iframe src="https://www.electionwrld.com/embed/nj/congress/5" title="New Jersey District 5, US House" width="100%" height="400" style="border:0;max-width:640px" loading="lazy"></iframe>
<p style="font-size:13px">Data: <a href="https://www.electionwrld.com">Election Wrld</a>, CC BY 4.0</p>Sources
Sources: MIT Election Data and Science Lab, U.S. House 1976-2024 (CC0 1.0), retrieved Oct 28, 2026, compiled by MIT Election Data and Science Lab (MEDSL) from official returns, not an official source; Census TIGERweb Legislative MapServer (120th CDs layer 0, 119th CDs layer 4, 2026 SLD upper layer 1 and lower layer 2) (US Census Bureau, public domain), retrieved Oct 28, 2026; unitedstates/congress-legislators (current) (CC0-1.0), retrieved Oct 28, 2026, compiled by the @unitedstates project volunteers (rosters from official congressional sources) from official returns, not an official source.
DataState data (JSON)Sources: MIT Election Data and Science Lab, U.S. House 1976-2024, FEC, DIME (ODC-BY), Portraits: unitedstates/images (public domain)Data as of Oct 28, 2026