

Ohio District 13
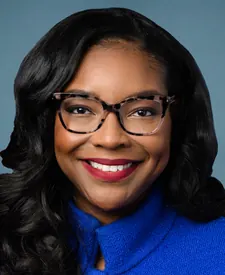
Tue, Nov 3 · Sitting member, elected on the old lines Emilia Strong Sykes Democratic since Jan 2023
No published poll names both candidates.District lines changed for 2026. Results from the old lines aren't shown.
Show all 3 candidates on the ballot
- Emilia Strong SykesIncumbentDemocratic
- Carey ColemanRepublican
- Sandeep DixitIndependent
Showing major-party nominees, incumbents and candidates with 5%+ in the latest poll or comparable fundraising.
- Lines for 2026
- Redrawn. 7.8% of residents were in a different district in 2024
- On the 2026 ballot
- 3 candidates
Side by side
Left column: ColemanRight column: Sykes
- Total receipts, 2025-2026 cycle, through Oct 14
- $170K
- $4.0M
- Cash on hand
- $63K
- $942K
- Donor-based spectrum
- LiberalCentristConservativeSykesNo published score for Coleman
- Races won and lost
- None on file
- 6-0
- Years since first win on file
- Not available
- 3
- Age on Election Day
- Not available
- 40
Money: FEC bulk data, through Oct 14. One or more are matched to the FEC by name, party and seat, so a total could belong to someone else.
How these are counted
Total receipts line of each candidate’s principal campaign committee, 2025-2026 cycle. Other sites may show career, six-year or all-committee totals, which differ. Coleman: $169,537 received, $62,793 cash on hand. Sykes: $3,990,519 received, $941,758 cash on hand. The spectrum is a published research score, not our rating. How this works. Wins and losses count the races in our results files, the same as each profile.
More about this race
Candidates on the ballot
- Emilia Strong SykesIncumbentDemocratic
- Carey ColemanRepublican
- Sandeep DixitIndependent
Source: liveresults.ohiosos.gov, dated Oct 29
All Ohio districts
- D 15+ pts
- D 5 to 15 pts
- D under 5 pts
- R under 5 pts
- R 5 to 15 pts
- R 15+ pts
- Other winner
- No data
Show these districts as a list (15)
- Ohio District 1· New lines for 2026, old result not shown
- Ohio District 2· New lines for 2026, old result not shown
- Ohio District 3· Joyce Beatty (D), Democratic by 41.4 points, 2024
- Ohio District 4· New lines for 2026, old result not shown
- Ohio District 5· New lines for 2026, old result not shown
- Ohio District 6· New lines for 2026, old result not shown
- Ohio District 7· New lines for 2026, old result not shown
- Ohio District 8· New lines for 2026, old result not shown
- Ohio District 9· New lines for 2026, old result not shown
- Ohio District 10· New lines for 2026, old result not shown
- Ohio District 11· Shontel M. Brown (D), Democratic by 58.7 points, 2024
- Ohio District 12· New lines for 2026, old result not shown
- Ohio District 13· New lines for 2026, old result not shown
- Ohio District 14· New lines for 2026, old result not shown
- Ohio District 15· New lines for 2026, old result not shown
Map settings
Vote in Ohio
Trouble voting? Election Protection hotline: 866-OUR-VOTE. A nonpartisan coalition of civil-rights and voting-rights groups, not a government service. 866ourvote.org
History (25 elections for this seat)
- Votes for listed candidates
- 386,390
- Election day
- November 5, 2024
- District map
- Older district map (2022 to 2025)
US House, Ohio District 13, 2024, every candidate Candidate Party Votes and share Share DemocraticEmilia Strong SykesWon Democratic 197,46651.1% RepublicanKevin Coughlin Republican 188,92448.9% - Votes for listed candidates
- 284,409
- Election day
- November 8, 2022
- District map
- Older district map (2022 to 2025)
US House, Ohio District 13, 2022, every candidate Candidate Party Votes and share Share DemocraticEmilia Strong SykesWonName as filed: Emilia Sykes Democratic 149,81652.7% RepublicanMadison Gesiotto Gilbert Republican 134,59347.3% - Votes for listed candidates
- 330,801
- Election day
- November 3, 2020
- District map
- Older district map (2012 to 2020)
US House, Ohio District 13, 2020, every candidate Candidate Party Votes and share Share DemocraticTim RyanWon Democratic 173,63152.5% RepublicanChristina M Hagan Republican 148,64844.9% LibertarianMichael Fricke Libertarian 8,5222.6% - Votes for listed candidates
- 251,370
- Election day
- November 6, 2018
- District map
- Older district map (2012 to 2020)
US House, Ohio District 13, 2018, every candidate Candidate Party Votes and share Share DemocraticTim RyanWon Democratic 153,32361.0% RepublicanChris Depizzo Republican 98,04739.0% - Votes for listed candidates
- 308,004
- Election day
- November 8, 2016
- District map
- Older district map (2012 to 2020)
US House, Ohio District 13, 2016, every candidate Candidate Party Votes and share Share DemocraticTim RyanWon Democratic 208,61067.7% RepublicanRichard A Morckel Republican 99,37732.3% Scattered write-insName as filed: Writein Write-in 170.0% - Votes for listed candidates
- 175,549
- Election day
- November 4, 2014
- District map
- Older district map (2012 to 2020)
US House, Ohio District 13, 2014, every candidate Candidate Party Votes and share Share DemocraticTim RyanWon Democratic 120,23068.5% RepublicanThomas Pekarek Republican 55,23331.5% Scattered write-insName as filed: Writein Write-in 860.0% - Votes for listed candidates
- 323,612
- Election day
- November 6, 2012
- District map
- Older district map (2012 to 2020)
US House, Ohio District 13, 2012, every candidate Candidate Party Votes and share Share DemocraticTim RyanWon Democratic 235,49272.8% RepublicanMarisha G Agana Republican 88,12027.2% - Votes for listed candidates
- 213,173
- Election day
- November 2, 2010
- District map
- Older district map (2002 to 2010)
US House, Ohio District 13, 2010, every candidate Candidate Party Votes and share Share DemocraticBetty SuttonWon Democratic 118,80655.7% RepublicanRom Ganley Republican 94,36744.3% - Votes for listed candidates
- 297,680
- Election day
- November 4, 2008
- District map
- Older district map (2002 to 2010)
US House, Ohio District 13, 2008, every candidate Candidate Party Votes and share Share DemocraticBetty SuttonWon Democratic 192,59364.7% RepublicanDavid S Potter Republican 105,05035.3% Scattered write-insName as filed: Writein Write-in 370.0% - Votes for listed candidates
- 221,561
- Election day
- November 7, 2006
- District map
- Older district map (2002 to 2010)
US House, Ohio District 13, 2006, every candidate Candidate Party Votes and share Share DemocraticBetty SuttonWon Democratic 135,63961.2% RepublicanCraig Foltin Republican 85,92238.8% - Votes for listed candidates
- 298,094
- Election day
- November 2, 2004
- District map
- Older district map (2002 to 2010)
US House, Ohio District 13, 2004, every candidate Candidate Party Votes and share Share DemocraticSherrod BrownWon Democratic 201,00467.4% RepublicanRobert Lucas Republican 97,09032.6% - Votes for listed candidates
- 178,382
- Election day
- November 5, 2002
- District map
- Older district map (2002 to 2010)
US House, Ohio District 13, 2002, every candidate Candidate Party Votes and share Share DemocraticSherrod BrownWon Democratic 123,02569.0% RepublicanEd Oliveros Republican 55,35731.0% - Votes for listed candidates
- 263,298
- Election day
- November 7, 2000
- District map
- Older district map (1992 to 2000)
US House, Ohio District 13, 2000, every candidate Candidate Party Votes and share Share DemocraticSherrod BrownWon Democratic 170,05864.6% RepublicanRick H Jeric Republican 84,29532.0% LibertarianMichael A Chmura Libertarian 5,8372.2% OtherDavid C Kluter Other 3,1081.2% - Votes for listed candidates
- 188,975
- Election day
- November 3, 1998
- District map
- Older district map (1992 to 2000)
US House, Ohio District 13, 1998, every candidate Candidate Party Votes and share Share DemocraticSherrod BrownWon Democratic 116,30961.5% RepublicanGrace L Drake Republican 72,66638.5% - Votes for listed candidates
- 244,505
- Election day
- November 5, 1996
- District map
- Older district map (1992 to 2000)
US House, Ohio District 13, 1996, every candidate Candidate Party Votes and share Share DemocraticSherrod BrownWon Democratic 148,69060.8% RepublicanKenneth C Blair Jr Republican 87,10835.6% OtherDavid Kluter Other 8,7073.6% - Votes for listed candidates
- 189,776
- Election day
- November 8, 1994
- District map
- Older district map (1992 to 2000)
US House, Ohio District 13, 1994, every candidate Candidate Party Votes and share Share DemocraticSherrod BrownWon Democratic 93,14749.1% RepublicanGregory A White Republican 86,42245.5% IndependentHoward Mason Independent 7,7774.1% IndependentJohn Michael Ryan Independent 2,4301.3% - Votes for listed candidates
- 252,258
- Election day
- November 3, 1992
- District map
- Older district map (1992 to 2000)
US House, Ohio District 13, 1992, every candidate Candidate Party Votes and share Share DemocraticSherrod BrownWon Democratic 134,48653.3% RepublicanMargaret R Mueller Republican 88,88935.2% IndependentMark Miller Independent 20,3208.1% IndependentTom Lawson Independent 4,7191.9% IndependentWerner J Lange Independent 3,8441.5% - Votes for listed candidates
- 164,862
- Election day
- November 6, 1990
- District map
- Older district map (1982 to 1990)
US House, Ohio District 13, 1990, every candidate Candidate Party Votes and share Share DemocraticDonald J PeaseWon Democratic 93,43156.7% RepublicanWilliam D Nielsen Republican 60,92537.0% IndependentJohn Michael Ryan Independent 10,5066.4% - Votes for listed candidates
- 196,361
- Election day
- November 8, 1988
- District map
- Older district map (1982 to 1990)
US House, Ohio District 13, 1988, every candidate Candidate Party Votes and share Share DemocraticDonald J PeaseWon Democratic 137,07469.8% RepublicanDwight Brown Republican 59,28730.2% - Votes for listed candidates
- 141,064
- Election day
- November 4, 1986
- District map
- Older district map (1982 to 1990)
US House, Ohio District 13, 1986, every candidate Candidate Party Votes and share Share DemocraticDonald J PeaseWon Democratic 88,61262.8% RepublicanWilliam D Nielsen Jr Republican 52,45237.2% - Votes for listed candidates
- 198,756
- Election day
- November 6, 1984
- District map
- Older district map (1982 to 1990)
US House, Ohio District 13, 1984, every candidate Candidate Party Votes and share Share DemocraticDonald J PeaseWon Democratic 131,92366.4% RepublicanWilliam G Schaffner Republican 59,61030.0% OtherOther Other 7,2233.6% - Votes for listed candidates
- 150,725
- Election day
- November 2, 1982
- District map
- Older district map (1982 to 1990)
US House, Ohio District 13, 1982, every candidate Candidate Party Votes and share Share DemocraticDonald J PeaseWon Democratic 92,29661.2% RepublicanTimothy Paul Martin Republican 53,37635.4% IndependentJames S Patton Independent 5,0533.4% - Votes for listed candidates
- 177,735
- Election day
- November 4, 1980
- District map
- Older district map (1972 to 1980)
US House, Ohio District 13, 1980, every candidate Candidate Party Votes and share Share DemocraticDonald J PeaseWon Democratic 113,43963.8% RepublicanDavid Earl Atmstrong Republican 64,29636.2% - Votes for listed candidates
- 124,144
- Election day
- November 7, 1978
- District map
- Older district map (1972 to 1980)
US House, Ohio District 13, 1978, every candidate Candidate Party Votes and share Share DemocraticDonald J PeaseWon Democratic 80,87565.1% RepublicanMark W Whitfield Republican 43,26934.9% - Votes for listed candidates
- 163,683
- Election day
- November 2, 1976
- District map
- Older district map (1972 to 1980)
US House, Ohio District 13, 1976, every candidate Candidate Party Votes and share Share DemocraticDonald J PeaseWon Democratic 108,06166.0% RepublicanWoodrow W Mathna Republican 49,82830.4% IndependentPatricia A Cortez Independent 5,7943.5%
1976 to 2024: MIT Election Data and Science Lab, U.S. House 1976-2024, retrieved Oct 28, 2026. Compiled by MIT Election Data and Science Lab (MEDSL) from official returns; not an official source
Ohio District 13 was redrawn for 2026, so every row here ran on older lines and covers different territory. The map in force, by state
Download and cite
Cite this page
Election Wrld. (2026). Ohio District 13, US House results. https://www.electionwrld.com/oh/congress/13. Retrieved October 30, 2026.
Embed this seat
<iframe src="https://www.electionwrld.com/embed/oh/congress/13" title="Ohio District 13, US House" width="100%" height="400" style="border:0;max-width:640px" loading="lazy"></iframe>
<p style="font-size:13px">Data: <a href="https://www.electionwrld.com">Election Wrld</a>, CC BY 4.0</p>Sources
Sources: MIT Election Data and Science Lab, U.S. House 1976-2024 (CC0 1.0), retrieved Oct 28, 2026, compiled by MIT Election Data and Science Lab (MEDSL) from official returns, not an official source; Census TIGERweb Legislative MapServer (120th CDs layer 0, 119th CDs layer 4, 2026 SLD upper layer 1 and lower layer 2) (US Census Bureau, public domain), retrieved Oct 28, 2026; unitedstates/congress-legislators (current) (CC0-1.0), retrieved Oct 28, 2026, compiled by the @unitedstates project volunteers (rosters from official congressional sources) from official returns, not an official source.
DataState data (JSON)Sources: MIT Election Data and Science Lab, U.S. House 1976-2024, FEC, DIME (ODC-BY), Portraits: unitedstates/images (public domain)Data as of Oct 29, 2026