

Ohio District 5
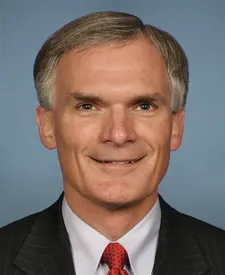
Tue, Nov 3 · Sitting member, elected on the old lines Robert E. Latta Republican since Dec 2007
No published poll names both candidates.District lines changed for 2026. Results from the old lines aren't shown.
Show all 3 candidates on the ballot
- Brian ShaverDemocratic
- Robert E. LattaIncumbentRepublican
- Michael VeloffLibertarian
Showing major-party nominees, incumbents and candidates with 5%+ in the latest poll or comparable fundraising.
- Lines for 2026
- Redrawn. 19.4% of residents were in a different district in 2024
- On the 2026 ballot
- 3 candidates
Side by side
Left column: LattaRight column: Shaver
- Total receipts, 2025-2026 cycle, through Oct 14
- $1.8M
- $59K
- Cash on hand
- $799K
- $39K
- Donor-based spectrum
- LiberalCentristConservativeLattaNo published score for Shaver
- Races
- Won 9 of 10
- None listed
- Years since first win
- 19
- Not available
- Age on Election Day
- 70
- Not available
Money: FEC bulk data, through Oct 14. One or more are matched to the FEC by name, party and seat, so a total could belong to someone else.
How these are counted
Total receipts line of each candidate’s principal campaign committee, 2025-2026 cycle. Other sites may show career, six-year or all-committee totals, which differ. Latta: $1,772,110 received, $799,134 cash on hand. Shaver: $59,140 received, $39,323 cash on hand. The spectrum is a published research score, not our rating. How this works. Wins and losses count the races in our results files, the same as each profile.
More about this race
Candidates on the ballot
- Brian ShaverDemocratic
- Robert E. LattaIncumbentRepublican
- Michael VeloffLibertarian
Source: liveresults.ohiosos.gov, dated Oct 29
All Ohio districts
- D 15+ pts
- D 5 to 15 pts
- D under 5 pts
- R under 5 pts
- R 5 to 15 pts
- R 15+ pts
- Other winner
- No data
Show these districts as a list (15)
- Ohio District 1· New lines for 2026, old result not shown
- Ohio District 2· New lines for 2026, old result not shown
- Ohio District 3· Joyce Beatty (D), Democratic by 41.4 points, 2024
- Ohio District 4· New lines for 2026, old result not shown
- Ohio District 5· New lines for 2026, old result not shown
- Ohio District 6· New lines for 2026, old result not shown
- Ohio District 7· New lines for 2026, old result not shown
- Ohio District 8· New lines for 2026, old result not shown
- Ohio District 9· New lines for 2026, old result not shown
- Ohio District 10· New lines for 2026, old result not shown
- Ohio District 11· Shontel M. Brown (D), Democratic by 58.7 points, 2024
- Ohio District 12· New lines for 2026, old result not shown
- Ohio District 13· New lines for 2026, old result not shown
- Ohio District 14· New lines for 2026, old result not shown
- Ohio District 15· New lines for 2026, old result not shown
Map settings
Vote in Ohio
Trouble voting? Election Protection hotline: 866-OUR-VOTE. A nonpartisan coalition of civil-rights and voting-rights groups, not a government service. 866ourvote.org
History (25 elections for this seat)
- Votes for listed candidates
- 378,657
- Election day
- November 5, 2024
- District map
- Older district map (2022 to 2025)
US House, Ohio District 5, 2024, every candidate Candidate Party Votes and share Share RepublicanRobert E. LattaWon Republican 255,63367.5% DemocraticKeith Mundy Democratic 123,02432.5% - Votes for listed candidates
- 279,937
- Election day
- November 8, 2022
- District map
- Older district map (2022 to 2025)
US House, Ohio District 5, 2022, every candidate Candidate Party Votes and share Share RepublicanRobert E. LattaWon Republican 187,30366.9% DemocraticCraig Swartz Democratic 92,63433.1% - Votes for listed candidates
- 377,981
- Election day
- November 3, 2020
- District map
- Older district map (2012 to 2020)
US House, Ohio District 5, 2020, every candidate Candidate Party Votes and share Share RepublicanRobert E. LattaWon Republican 257,01968.0% DemocraticNick Rubando Democratic 120,96232.0% - Votes for listed candidates
- 283,617
- Election day
- November 6, 2018
- District map
- Older district map (2012 to 2020)
US House, Ohio District 5, 2018, every candidate Candidate Party Votes and share Share RepublicanRobert E. LattaWonName as filed: Bob Latta Republican 176,56962.3% DemocraticJ Michael Galbraith Democratic 99,65535.1% LibertarianDon Kissick Libertarian 7,3932.6% - Votes for listed candidates
- 344,991
- Election day
- November 8, 2016
- District map
- Older district map (2012 to 2020)
US House, Ohio District 5, 2016, every candidate Candidate Party Votes and share Share RepublicanRobert E. LattaWon Republican 244,59970.9% DemocraticJames Neu Jr Democratic 100,39229.1% - Votes for listed candidates
- 202,300
- Election day
- November 4, 2014
- District map
- Older district map (2012 to 2020)
US House, Ohio District 5, 2014, every candidate Candidate Party Votes and share Share RepublicanRobert E. LattaWon Republican 134,44966.5% DemocraticRobert L Fry Democratic 58,50728.9% LibertarianEric Eberly Libertarian 9,3444.6% - Votes for listed candidates
- 351,878
- Election day
- November 6, 2012
- District map
- Older district map (2012 to 2020)
US House, Ohio District 5, 2012, every candidate Candidate Party Votes and share Share RepublicanRobert E. LattaWon Republican 201,51457.3% DemocraticAngela Zimmann Democratic 137,80639.2% LibertarianEric Eberly Libertarian 12,5583.6% - Votes for listed candidates
- 207,453
- Election day
- November 2, 2010
- District map
- Older district map (2002 to 2010)
US House, Ohio District 5, 2010, every candidate Candidate Party Votes and share Share RepublicanRobert E. LattaWon Republican 140,70367.8% DemocraticCaleb Finkenbiner Democratic 54,91926.5% LibertarianBrian L Smith Libertarian 11,8315.7% - Votes for listed candidates
- 294,745
- Election day
- November 4, 2008
- District map
- Older district map (2002 to 2010)
US House, Ohio District 5, 2008, every candidate Candidate Party Votes and share Share RepublicanRobert E. LattaWon Republican 188,90564.1% DemocraticGeorge F Mays Democratic 105,84035.9% - Votes for listed candidates
- 228,357
- Election day
- November 7, 2006
- District map
- Older district map (2002 to 2010)
US House, Ohio District 5, 2006, every candidate Candidate Party Votes and share Share RepublicanPaul E GillmorWon Republican 129,81356.8% DemocraticRobin Weirauch Democratic 98,54443.2% - Votes for listed candidates
- 293,305
- Election day
- November 2, 2004
- District map
- Older district map (2002 to 2010)
US House, Ohio District 5, 2004, every candidate Candidate Party Votes and share Share RepublicanPaul E GillmorWon Republican 196,64967.0% DemocraticRobin Weirauch Democratic 96,65633.0% - Votes for listed candidates
- 188,254
- Election day
- November 5, 2002
- District map
- Older district map (2002 to 2010)
US House, Ohio District 5, 2002, every candidate Candidate Party Votes and share Share RepublicanPaul E GillmorWon Republican 126,28667.1% DemocraticRoger Anderson Democratic 51,87227.6% IndependentJohn Green Independent 10,0965.4% - Votes for listed candidates
- 243,340
- Election day
- November 7, 2000
- District map
- Older district map (1992 to 2000)
US House, Ohio District 5, 2000, every candidate Candidate Party Votes and share Share RepublicanPaul E GillmorWon Republican 169,85769.8% DemocraticDannie Edmon Democratic 62,13825.5% OtherDavid J Schaffer Other 5,8812.4% LibertarianJohn F Green Libertarian 5,4642.2% - Votes for listed candidates
- 185,905
- Election day
- November 3, 1998
- District map
- Older district map (1992 to 2000)
US House, Ohio District 5, 1998, every candidate Candidate Party Votes and share Share RepublicanPaul E GillmorWon Republican 123,97966.7% DemocraticSusan Davenport Democratic 61,92633.3% - Votes for listed candidates
- 238,523
- Election day
- November 5, 1996
- District map
- Older district map (1992 to 2000)
US House, Ohio District 5, 1996, every candidate Candidate Party Votes and share Share RepublicanPaul E GilmorWon Republican 145,89261.2% DemocraticAnnie Saunders Democratic 81,17034.0% OtherDavid J Schaffer Other 11,4614.8% - Votes for listed candidates
- 185,214
- Election day
- November 8, 1994
- District map
- Older district map (1992 to 2000)
US House, Ohio District 5, 1994, every candidate Candidate Party Votes and share Share RepublicanPaul E GillmorWon Republican 135,87973.4% DemocraticJarrod Tudor Democratic 49,33526.6% - Votes for listed candidates
- 187,860
- Election day
- November 3, 1992
- District map
- Older district map (1992 to 2000)
US House, Ohio District 5, 1992, every candidate Candidate Party Votes and share Share RepublicanPaul E GillmorWon Republican 187,860100.0% - Votes for listed candidates
- 165,920
- Election day
- November 6, 1990
- District map
- Older district map (1982 to 1990)
US House, Ohio District 5, 1990, every candidate Candidate Party Votes and share Share RepublicanPaul E GillmorWon Republican 113,61568.5% DemocraticP Scott Mange Democratic 41,69325.1% IndependentJohn E Jackson Independent 10,6126.4% - Votes for listed candidates
- 204,310
- Election day
- November 8, 1988
- District map
- Older district map (1982 to 1990)
US House, Ohio District 5, 1988, every candidate Candidate Party Votes and share Share RepublicanPaul E GillmorWon Republican 123,83860.6% DemocraticTom Murray Democratic 80,47239.4% - Votes for listed candidates
- 156,880
- Election day
- November 4, 1986
- District map
- Older district map (1982 to 1990)
US House, Ohio District 5, 1986, every candidate Candidate Party Votes and share Share RepublicanDelbert L LattaWon Republican 102,01665.0% DemocraticTom Murray Democratic 54,86435.0% - Votes for listed candidates
- 211,391
- Election day
- November 6, 1984
- District map
- Older district map (1982 to 1990)
US House, Ohio District 5, 1984, every candidate Candidate Party Votes and share Share RepublicanDelbert L LattaWon Republican 132,58262.7% DemocraticJames R Sherck Democratic 78,80937.3% - Votes for listed candidates
- 156,570
- Election day
- November 2, 1982
- District map
- Older district map (1982 to 1990)
US House, Ohio District 5, 1982, every candidate Candidate Party Votes and share Share RepublicanDelbert L LattaWon Republican 86,45055.2% DemocraticJames R Sherck Democratic 70,12044.8% - Votes for listed candidates
- 194,707
- Election day
- November 4, 1980
- District map
- Older district map (1972 to 1980)
US House, Ohio District 5, 1980, every candidate Candidate Party Votes and share Share RepublicanDelbert L LattaWon Republican 137,00370.4% DemocraticJames R Sherck Democratic 57,70429.6% - Votes for listed candidates
- 136,618
- Election day
- November 7, 1978
- District map
- Older district map (1972 to 1980)
US House, Ohio District 5, 1978, every candidate Candidate Party Votes and share Share RepublicanDelbert LattaWon Republican 85,54762.6% DemocraticJames Robert Sherek Democratic 51,07137.4% - Votes for listed candidates
- 185,214
- Election day
- November 2, 1976
- District map
- Older district map (1972 to 1980)
US House, Ohio District 5, 1976, every candidate Candidate Party Votes and share Share RepublicanDelbert L LattaWon Republican 124,91067.4% DemocraticBruce Edwards Democratic 60,30432.6%
1976 to 2024: MIT Election Data and Science Lab, U.S. House 1976-2024, retrieved Oct 28, 2026. Compiled by MIT Election Data and Science Lab (MEDSL) from official returns; not an official source
Ohio District 5 was redrawn for 2026, so every row here ran on older lines and covers different territory. The map in force, by state
Download and cite
Cite this page
Election Wrld. (2026). Ohio District 5, US House results. https://www.electionwrld.com/oh/congress/5. Retrieved October 30, 2026.
Embed this seat
<iframe src="https://www.electionwrld.com/embed/oh/congress/5" title="Ohio District 5, US House" width="100%" height="400" style="border:0;max-width:640px" loading="lazy"></iframe>
<p style="font-size:13px">Data: <a href="https://www.electionwrld.com">Election Wrld</a>, CC BY 4.0</p>Sources
Sources: MIT Election Data and Science Lab, U.S. House 1976-2024 (CC0 1.0), retrieved Oct 28, 2026, compiled by MIT Election Data and Science Lab (MEDSL) from official returns, not an official source; Census TIGERweb Legislative MapServer (120th CDs layer 0, 119th CDs layer 4, 2026 SLD upper layer 1 and lower layer 2) (US Census Bureau, public domain), retrieved Oct 28, 2026; unitedstates/congress-legislators (current) (CC0-1.0), retrieved Oct 28, 2026, compiled by the @unitedstates project volunteers (rosters from official congressional sources) from official returns, not an official source.
DataState data (JSON)Sources: MIT Election Data and Science Lab, U.S. House 1976-2024, FEC, DIME (ODC-BY), Portraits: unitedstates/images (public domain)Data as of Oct 29, 2026