

Texas Governor
Tue, Nov 3 · Governor Greg Abbott Republican since Jan 2015
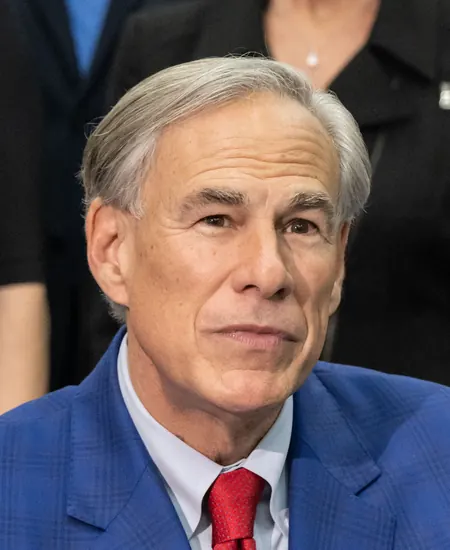
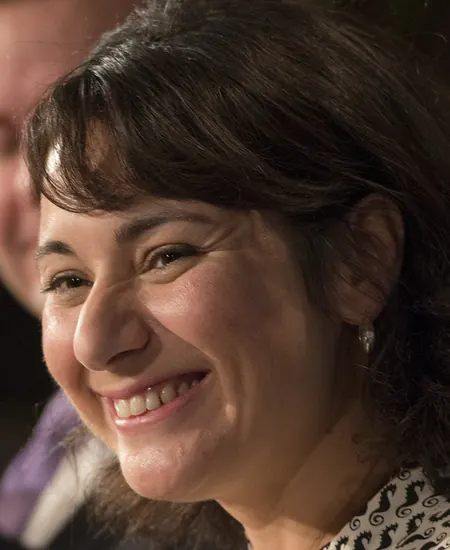
Greg Abbott 48.7Gina Hinojosa 46.4
Average of 14 polls, Sep 18 to Oct 29, from VoteHub · how it’s calculated
Newest poll
Also in the average: Pat Dixon 1.6Newest · ActiVote, field dates Oct 23 to Oct 29, released Oct 30, 400 likely votersPolls fetched Oct 30, 2:02 a.m. ET, from VoteHub
Show all 3 candidates on the ballot
- Gina HinojosaDemocratic
- Greg AbbottIncumbentRepublican
- Pat DixonLibertarian
Showing major-party nominees, incumbents and candidates with 5%+ in the latest poll or comparable fundraising.
Polls over time
46 polls, through Election Day Nov 3The thick line is the 7-week average, not a forecast. How it’s calculated. All polls. Polls fetched Oct 30, 2:02 a.m. ET, from VoteHub.
The polls in this chart (46)
11 polls released in the last 14 days · latest results range from 45.8 to 47.9% (D) and 48 to 52.1% (R) (newest 5 polls on the chart)
46 of the 48 polls for this race, each with both names, plotted on the field end date.
| Pollster | Field dates | Released | Sample | Hinojosa | Abbott |
|---|---|---|---|---|---|
| ActiVote | Oct 23 to Oct 29 | Oct 30 | 400 likely voters | 47.9 | 52.1 |
| Quantus Insights | Oct 26 to Oct 28 | Oct 30 | 1,221 likely voters | 45.8 | 50.7 |
| CNN/SSRS | Oct 20 to Oct 27 | Oct 29 | 923 likely voters | 46 | 48 |
| Texas Southern University Barbara Jordan Public Policy Research and Survey Center | Oct 21 to Oct 25 | Oct 29 | 2,000 likely voters | 47 | 50 |
| YouGov | Oct 13 to Oct 21 | Oct 27 | 1,000 registered voters | 46 | 48 |
| ActiVote | Oct 17 to Oct 21 | Oct 22 | 400 likely voters | 47.5 | 52.5 |
| VoteHub/Verasight | Oct 1 to Oct 20 | Oct 23 | 601 likely voters | 46.4 | 47.7 |
| Beacon Research/Shaw & Co. Research | Oct 15 to Oct 19 | Oct 22 | 1,398 likely voters | 47 | 52 |
| Emerson College | Oct 17 to Oct 19 | Oct 22 | 1,000 likely voters | 45 | 49 |
| Slingshot Strategies | Oct 15 to Oct 18 | Oct 23 | 969 likely voters | 48 | 51 |
| Pollfinity | Oct 15 to Oct 18 | Oct 22 | 278 registered voters | 46 | 45 |
| ActiVote | Sep 30 to Oct 14 | Oct 15 | 400 likely voters | 49.1 | 50.9 |
| ReconMR/Siena University | Oct 5 to Oct 8 | Oct 13 | 617 likely voters | 47 | 48 |
| The New York Times/Siena University | Sep 22 to Sep 30 | Oct 4 | 605 likely voters | 49 | 46 |
| Guidant Polling and Strategy | Sep 20 to Sep 28 | Oct 8 | 800 likely voters | 44 | 46 |
| University of Massachusetts Lowell Center for Public Opinion/YouGov | Sep 18 to Sep 28 | Oct 8 | 850 likely voters | 44 | 48 |
| Beacon Research/Shaw & Co. Research | Sep 24 to Sep 28 | Oct 2 | 881 likely voters | 47 | 52 |
| Slingshot Strategies | Sep 19 to Sep 22 | Sep 25 | 1,007 likely voters | 46 | 50 |
| Texas Southern University Barbara Jordan Public Policy Research and Survey Center | Sep 15 to Sep 19 | Sep 22 | 1,800 likely voters | 45 | 49 |
| Emerson College | Sep 12 to Sep 14 | Sep 17 | 1,000 likely voters | 46 | 49 |
| ReconMR/Siena University | Sep 8 to Sep 11 | Sep 17 | 614 likely voters | 49 | 45 |
| YouGov | Aug 27 to Sep 4 | Sep 10 | 1,000 registered voters | 47 | 47 |
| Fabrizio Ward/Impact Research | Aug 30 to Sep 1 | Sep 10 | 895 likely voters | 46 | 49 |
| Slingshot Strategies | Aug 21 to Aug 24 | Aug 27 | 1,000 likely voters | 42 | 49 |
| The Texas Politics Project at the University of Texas at Austin/YouGov | Aug 5 to Aug 13 | Aug 26 | 1,218 registered voters | 40 | 45 |
| Emerson College | Aug 9 to Aug 10 | Aug 13 | 1,000 likely voters | 45 | 49 |
| Cygnal | Jul 29 to Jul 31 | Aug 12 | 800 likely voters | 46 | 49 |
| Wedgewood Polls | Jul 30 to Jul 31 | Aug 3 | 800 likely voters | 44 | 50 |
| ReconMR/Siena University | Jul 27 to Jul 30 | Aug 7 | 619 likely voters | 45 | 46 |
| Texas Southern University Barbara Jordan Public Policy Research and Survey Center | Jul 27 to Jul 30 | Aug 4 | 1,200 likely voters | 43 | 49 |
| Beacon Research/Shaw & Co. Research | Jul 23 to Jul 27 | Jul 30 | 1,006 registered voters | 49 | 50 |
| Slingshot Strategies | Jul 15 to Jul 17 | Jul 28 | 1,048 likely voters | 42 | 45 |
| The New York Times/Siena University | Jun 19 to Jun 27 | Jun 30 | 656 likely voters | 44 | 51 |
| Texas Politics Project at the University of Texas/YouGov | Jun 5 to Jun 12 | Jun 23 | 1,200 registered voters | 40 | 47 |
| ReconMR/Siena University | Jun 1 to Jun 4 | Jun 9 | 807 likely voters | 44 | 49 |
| Slingshot Strategies | May 27 to May 28 | May 30 | 1,670 likely voters | 41 | 46 |
| Public Policy Polling | May 22 to May 23 | May 28 | 643 likely voters | 44 | 48 |
| Texas Southern University Barbara Jordan Public Policy Research and Survey Center | Apr 22 to May 6 | May 18 | 1,223 likely voters | 43 | 49 |
| Slingshot Strategies | Apr 17 to Apr 20 | May 5 | 1,018 likely voters | 43 | 48 |
| The Texas Politics Project at the University of Texas at Austin/YouGov | Apr 10 to Apr 20 | May 5 | 1,200 registered voters | 38 | 44 |
| University of Texas at Tyler Center for Opinion Research | Feb 13 to Feb 22 | May 5 | 1,117 registered voters | 41 | 49 |
| University of Texas at Tyler | Feb 13 to Feb 22 | Apr 27 | 1,117 registered voters | 41 | 49 |
| University of Houston Hobby School of Public Affairs/YouGov | Jan 20 to Jan 31 | May 5 | 1,502 likely voters | 42 | 49 |
| University of Houston/YouGov | Jan 20 to Jan 31 | Apr 27 | 1,502 likely voters | 42 | 49 |
| Emerson College | Jan 10 to Jan 12 | May 5 | 1,165 registered voters | 42.3 | 50.2 |
| Emerson College | Jan 10 to Jan 12 | Apr 27 | 1,165 registered voters | 42.3 | 50.2 |
Polls left off the chart (2 of 48)
| Poll | Why it is not on the chart |
|---|---|
| University of Texas at Tyler Center for Opinion ResearchFeb 13 to Feb 22 | Names fewer than two candidates on this ballot (lists Chris Bell, Greg Abbott) |
| Slingshot StrategiesAug 27 to Aug 29 | Names fewer than two candidates on this ballot (lists Rep, Dem) |
Side by side
Left column: AbbottRight column: Hinojosa
- Donor-based spectrum
- LiberalCentristConservativeAbbottNo published score for Hinojosa
- Races won and lost
- 8-0
- None on file
- Years since first win on file
- 12
- Not available
- Age on Election Day
- 68
- 52
How these are counted
The spectrum is a published research score, not our rating. How this works. Wins and losses count the races in our results files, the same as each profile.
What changed in this race
Newest firstNEW POLLTexas Governor
Texas Governor: Greg Abbott 52.1, Gina Hinojosa 47.9
ActiVote, Oct 23 to Oct 29, 400 likely voters
NEW POLLTexas Governor
Texas Governor: Greg Abbott 51.6, Gina Hinojosa 46.3
Quantus Insights, Oct 26 to Oct 28, 1,221 likely voters
More about this race
Candidates on the ballot
- Gina HinojosaDemocratic
- Greg AbbottIncumbentRepublican
- Pat DixonLibertarian
Source: sos.state.tx.us (PDF), dated Aug 28
Vote in Texas
- Register
- Registration, polling place, sample ballot lookup, election office
- Mail ballot status
- ID rules
Trouble voting? Election Protection hotline: 866-OUR-VOTE. A nonpartisan coalition of civil-rights and voting-rights groups, not a government service. 866ourvote.org
History (8 elections for this seat)
- Votes for listed candidates
- 8,101,271
- Election day
- November 8, 2022
Governor, Texas, 2022, every candidate Candidate Party Votes and share Share RepublicanGreg AbbottWon(incumbent) Republican 4,437,09954.8% DemocraticBeto O'Rourke Democratic 3,553,65643.9% LibertarianMark Tippetts Libertarian 81,9321.0% GreenDelilah Barrios Green 28,5840.4% - Votes for listed candidates
- 8,343,443
- Election day
- November 6, 2018
Governor, Texas, 2018, every candidate Candidate Party Votes and share Share RepublicanGreg AbbottWon(incumbent) Republican 4,656,19655.8% DemocraticLupe Valdez Democratic 3,546,61542.5% LibertarianMark Tippetts Libertarian 140,6321.7% - Votes for listed candidates
- 4,717,206
- Election day
- November 4, 2014
Governor, Texas, 2014, every candidate Candidate Party Votes and share Share RepublicanGreg AbbottWon Republican 2,796,54759.3% DemocraticWendy R. Davis Democratic 1,835,59638.9% LibertarianKathie Glass Libertarian 66,5431.4% GreenBrandon Parmer Green 18,5200.4% - Votes for listed candidates
- 4,979,870
- Election day
- November 2, 2010
Governor, Texas, 2010, every candidate Candidate Party Votes and share Share RepublicanRick PerryWon(incumbent) Republican 2,737,48155.0% DemocraticBill White Democratic 2,106,39542.3% LibertarianKathie Glass Libertarian 109,2112.2% GreenDeb Shafto Green 19,5160.4% OtherAndy Barron Write-in 7,2670.1% - Votes for listed candidates
- 4,399,116
- Election day
- November 7, 2006
Governor, Texas, 2006, every candidate Candidate Party Votes and share Share RepublicanRick PerryWon(incumbent) Republican 1,716,79239.0% DemocraticChris Bell Democratic 1,310,33729.8% IndependentCarole Keeton Strayhorn Independent 796,85118.1% IndependentKinky Friedman Independent 547,67412.4% LibertarianJames Werner Libertarian 26,7490.6% OtherPatriot Dillon Write-in 7130.0% - Votes for listed candidates
- 4,553,987
- Election day
- November 5, 2002
Governor, Texas, 2002, every candidate Candidate Party Votes and share Share RepublicanRick PerryWon(incumbent) Republican 2,632,59157.8% DemocraticTony Sanchez Democratic 1,819,79840.0% LibertarianJeff Daiell Libertarian 66,7201.5% GreenRahul Mahajan Green 32,1870.7% Scattered write-ins 2,6910.1% - Votes for listed candidates
- 3,738,078
- Election day
- November 3, 1998
Governor, Texas, 1998, every candidate Candidate Party Votes and share Share RepublicanGeorge W. BushWon(incumbent) Republican 2,550,82168.2% DemocraticGarry Mauro Democratic 1,165,59231.2% LibertarianLester R. 'Les' Turlington Jr. Libertarian 20,7110.6% Scattered write-ins 9540.0% - Votes for listed candidates
- 4,396,242
- Election day
- November 8, 1994
Governor, Texas, 1994, every candidate Candidate Party Votes and share Share RepublicanGeorge W. BushWon Republican 2,350,99453.5% DemocraticAnn W. Richards(incumbent) Democratic 2,016,92845.9% LibertarianKeary Ehlers Libertarian 28,3200.6%
1994 to 2022: Cha, Kuriwaki and Snyder, Candidates in American General Elections, version 3.1 (2006-2023 governor rows), retrieved Oct 28, 2026. Compiled by Cha, Kuriwaki and Snyder (Harvard Dataverse) from official returns; not an official source
Governor races before 1994 are not on file.
Data notes (16)
- Source priority per race: (1) a state election office's own certified results parsed in scripts/data/gov_results.py (NJ Division of Elections PDFs, Virginia Department of Elections, the Civera ElectionStats databases run by CT, VA, VT, CO, NY, NM and SC, the Massachusetts Secretary of the Commonwealth, the NC State Board of Elections archive); (2) the open Cha/Kuriwaki/Snyder 'Candidates in American General Elections' file (Harvard Dataverse, CC0), which copies each state's statement of vote; (3) OpenElections county files and the 2020 Dataverse official-results tables, used only to add named candidates the Dataverse file omitted and to add the write-in count; (4) MEDSL precinct sums, used the same way and only when their Democratic and Republican totals agree with the Dataverse rows to 0.3 percent. Each race's source is listed in web/data/sources/gov-results.json.
- total is the sum of the candidate rows in the file, and pct is votes divided by that total, rounded to one decimal. Blank, void, over and under votes are never in total. Write-in votes are in total as a 'Write-ins' row (writein: true) wherever a source reports them: the official databases, OpenElections, and MEDSL precinct returns. The Dataverse file leaves write-ins out, so MEDSL's write-in sum is added when MEDSL's count for every named candidate equals the Dataverse count exactly (for example AK 2022, 784 write-ins, and AL 2022, 9,432, both matching the state's statement of vote). Each race's source ids are in the race's source and sourceAlso fields and in the gov-results-<st> entry of sources.json.
- 151 races not taken from a state's own results file have no write-in row. Either the state counted no write-ins, or the sources on file leave them out (MEDSL's precinct sums did not match every named candidate exactly, or MEDSL has no file for that year); where they were left out, total is short by the write-ins and pct can run slightly above the state's printed percentage: AK 2006, AK 2010, AK 2014, AL 2006, AL 2010, AL 2014, AL 2018, AR 2006, AR 2014, AR 2018, AR 2022, AZ 2002, AZ 2014, AZ 2022, CA 2014, CA 2018, CA 2022, DE 2008, DE 2012, DE 2016, DE 2020, DE 2024, GA 2014, GA 2018, HI 2006, HI 2010, HI 2014, HI 2018, HI 2022, IA 2006, IA 2010, IA 2014, ID 1998, ID 2006, ID 2010, ID 2022, IL 2010, IL 2014, IL 2018, IN 2004, IN 2008, IN 2012, IN 2016, IN 2020, KS 2006, KS 2010, KS 2014, KS 2018, KS 2022, KY 2007, KY 2011, KY 2015, KY 2019, LA 2007, LA 2011, LA 2015, LA 2019, LA 2023, MD 2006, MD 2014, MD 2022, ME 2006, ME 2010, ME 2014, ME 2022, MI 2006, MI 2010, MI 2014, MI 2022, MN 2006, MN 2010, MN 2014, MO 2020, MS 2007, MS 2011, MS 2015, MS 2019, MS 2023, MT 2000, MT 2004, MT 2008, MT 2012, MT 2016, MT 2020, MT 2024, ND 2008, NE 2006, NE 2010, NE 2014, NE 2018, NE 2022, NH 2008, NH 2010, NH 2012, NH 2014, NH 2024, NM 2010, NV 2006, NV 2010, NV 2014, NV 2018, NV 2022, OH 2014, OH 2018, OK 2006, OK 2010, OK 2014, OK 2018, OK 2022, OR 2006, OR 2010, OR 2014, OR 2018, OR 2022, PA 2002, PA 2006, PA 2010, PA 2014, PA 2018, PA 2022, RI 2006, RI 2010, RI 2014, SC 2006, SD 2006, SD 2010, SD 2014, SD 2018, SD 2022, TX 2014, TX 2018, TX 2022, UT 2008, UT 2010, UT 2012, UT 2020, WA 2008, WA 2012, WA 2016, WI 2006, WI 2010, WI 2014, WI 2018, WV 2008, WV 2011, WV 2012, WV 2016, WV 2020, WV 2024, WY 2002, WY 2006.
- party is D, R, I, L, G, O or N from the party label in the source; party_label keeps the source's wording. The Dataverse file prints short labels (Lbt, Grn, Const, DFL, NPA); those are expanded to Libertarian, Green, Constitution, Democratic-Farmer-Labor and No Party Affiliation. Fusion candidates (NY, CT, SC, and the Democratic-Progressive line in VT) are one candidate with all of their ballot lines added together.
- Names: the Dataverse file stores 'LAST, FIRST MIDDLE (NICKNAME), SUFFIX'; the display name uses the nickname when there is one (Josh Shapiro, Bob Riley) and otherwise the given names. All-caps source names were title-cased by rule and can be wrong for internal capitals (DiGiulio, DeWine). Official lists that print only surnames (NJ 1997; MA tickets from 2010 on) take the full name from the Dataverse row of the same race where the surname and party match, otherwise stay surname-only.
- incumbent is true or false only for races built from the Dataverse file (it carries an incumbency code; code 3, a governor who succeeded to the office, is treated as incumbent). It is null for official-source races and for candidates added from OpenElections or MEDSL.
- Louisiana uses an open primary with a runoff. One race per election is stored: the round that decided it (the October primary when someone won more than 50 percent, otherwise the November runoff, marked runoff:true). Exact dates for those rounds come from the Dataverse/official files where present and are set in the script otherwise (LA_DATES); check them before showing a date.
- Recall elections (Wisconsin June 2012, California September 2021) are not included. Only regular and special general elections for the office are stored; primaries and runoff primaries are not.
- scripts/data/federal_results.py, if it is re-run, rewrites every web/data/results/governor/{ST}.json to []. Run scripts/data/gov_results.py after it, or remove build_governor() from that script.
- TX: No governor general-election result in this file for 1 of 9 expected election years between 1990 and 2025: 1990. No open or official bulk source was found and parsed for them yet; they are gaps, not zeroes.
- 2006: built from the Dataverse candidates file only; no second source agreed with it at candidate level, so a minor-party candidate who is missing from that file would be missing here too
- 2010: built from the Dataverse candidates file only; no second source agreed with it at candidate level, so a minor-party candidate who is missing from that file would be missing here too
- 2014: built from the Dataverse candidates file only; no second source agreed with it at candidate level, so a minor-party candidate who is missing from that file would be missing here too
- Candidate name is the sitting governor's officials-file spelling for 16 rows (the race's winner, same state, race within the governor's tenure, same surname and a compatible first name). Text encoding and casing are repaired by scripts/data/names.py.
- Governor races earlier than the first year listed are not loaded yet for 50 states (AK from 2006; AL from 2006; AR from 2002; AZ from 2002; CA from 2002; CO from 1990; CT from 1990; DE from 2008; FL from 1990; GA from 2002; HI from 2006; IA from 2002; ID from 1994; IL from 2006; IN from 2004; KS from 2006; KY from 2007; LA from 2007; MA from 1990; MD from 2006; ME from 2006; MI from 2006; MN from 2006; MO from 2008; MS from 2007; MT from 2000; NC from 1992; ND from 2008; NE from 2006; NH from 2006; NJ from 1993; NM from 2002; NV from 2006; NY from 1994; OH from 2002; OK from 2006; OR from 2006; PA from 2002; RI from 2006; SC from 2006; SD from 2006; TN from 2002; TX from 1994; UT from 2008; VA from 1993; VT from 1990; WA from 2008; WI from 2006; WV from 2000; WY from 2002). The sources on file start later; nothing was filled in from memory. Each governor page says so under History.
- 1 duplicate candidate rows merged: a 0-vote placeholder row beside the real row is dropped. governor/CO 2022 Paul Noël Fiorino
Download and cite
Cite this page
Election Wrld. (2026). Governor of Texas. https://www.electionwrld.com/tx/governor. Retrieved October 30, 2026.
Sources
Sources: Wikidata SPARQL (governor position holders, party) (CC0-1.0), retrieved Oct 28, 2026, compiled by the Wikidata community (not an official source; to be cross-checked against official governor pages) from official returns, not an official source; 3 U.S.C. 1, 2 U.S.C. 1 and 7: Election Day, first Tuesday after the first Monday in November (US government work, public domain), retrieved Oct 28, 2026; Cha, Kuriwaki and Snyder, Candidates in American General Elections, version 3.1 (2006-2023 governor rows) (CC0 1.0), retrieved Oct 28, 2026, compiled by Cha, Kuriwaki and Snyder (Harvard Dataverse) from official returns, not an official source; Cha, Kuriwaki and Snyder, Candidates in American General Elections, version 4.1 (2024 governor rows) (CC0 1.0), retrieved Oct 28, 2026, compiled by Cha, Kuriwaki and Snyder (Harvard Dataverse) from official returns, not an official source; OpenElections state results repositories (github.com/openelections/openelections-data-<st>) (No license is stated in the OpenElections repositories. OpenElections says its data is free for anyone to use. Written permission requested (docs/PERMISSION-REQUESTS.md). No CC0 claim.), retrieved Oct 28, 2026, compiled by OpenElections volunteers from official returns, not an official source.
DataState data (JSON)Sources: Cha, Kuriwaki and Snyder, Candidates in American General Elections, version 3.1 (2006-2023 governor rows), VoteHub polls (CC BY 4.0), DIME (ODC-BY), Photo creditsData as of Oct 28, 2026