

California District 35
Tue, Nov 3 · Sitting member, elected on the old lines Norma J. Torres Democratic since Jan 2015
No published poll names both candidates.District lines changed for 2026. Results from the old lines aren't shown.
- Lines for 2026
- Redrawn. 31.9% of residents were in a different district in 2024
- On the 2026 ballot
- 2 candidates
Side by side
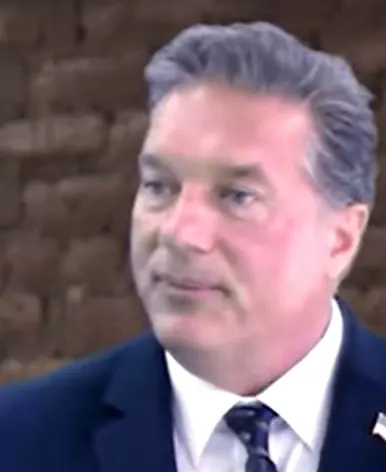
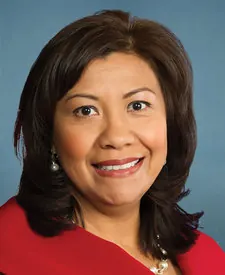
Left column: CargileRight column: Torres
- Total receipts, 2025-2026 cycle, through Oct 14
- $10K
- $923K
- Cash on hand
- $448
- $245K
- Donor-based spectrum
- LiberalCentristConservativeCargileTorres
- Races won and lost
- 0-3
- 6-0
- Years since first win on file
- Not available
- 11
- Age on Election Day
- Not available
- 61
Money: FEC bulk data, through Oct 14. One or more are matched to the FEC by name, party and seat, so a total could belong to someone else.
How these are counted
Total receipts line of each candidate’s principal campaign committee, 2025-2026 cycle. Other sites may show career, six-year or all-committee totals, which differ. Cargile: $9,799 received, $448 cash on hand. Torres: $922,924 received, $244,897 cash on hand. The spectrum is a published research score, not our rating. How this works. Wins and losses count the races in our results files, the same as each profile.
More about this race
Candidates on the ballot
- Norma J. TorresIncumbentDemocraticU.S. Representative
- Mike CargileRepublicanSmall Businessman
Source: elections.cdn.sos.ca.gov (PDF), dated Aug 27
All California districts
- D 15+ pts
- D 5 to 15 pts
- D under 5 pts
- R under 5 pts
- R 5 to 15 pts
- R 15+ pts
- Other winner
- No data
Show these districts as a list (52)
- California District 1· New lines for 2026, old result not shown
- California District 2· New lines for 2026, old result not shown
- California District 3· New lines for 2026, old result not shown
- California District 4· New lines for 2026, old result not shown
- California District 5· New lines for 2026, old result not shown
- California District 6· New lines for 2026, old result not shown
- California District 7· New lines for 2026, old result not shown
- California District 8· New lines for 2026, old result not shown
- California District 9· New lines for 2026, old result not shown
- California District 10· New lines for 2026, old result not shown
- California District 11· Nancy Pelosi (D), Democratic by 62.0 points, 2024
- California District 12· Lateefah Simon (D), Democratic by 30.8 points, 2024
- California District 13· New lines for 2026, old result not shown
- California District 14· New lines for 2026, old result not shown
- California District 15· Kevin Mullin (D), Democratic by 46.2 points, 2024
- California District 16· New lines for 2026, old result not shown
- California District 17· New lines for 2026, old result not shown
- California District 18· New lines for 2026, old result not shown
- California District 19· Jimmy Panetta (D), Democratic by 38.6 points, 2024
- California District 20· New lines for 2026, old result not shown
- California District 21· New lines for 2026, old result not shown
- California District 22· New lines for 2026, old result not shown
- California District 23· New lines for 2026, old result not shown
- California District 24· New lines for 2026, old result not shown
- California District 25· New lines for 2026, old result not shown
- California District 26· New lines for 2026, old result not shown
- California District 27· New lines for 2026, old result not shown
- California District 28· New lines for 2026, old result not shown
- California District 29· New lines for 2026, old result not shown
- California District 30· New lines for 2026, old result not shown
- California District 31· New lines for 2026, old result not shown
- California District 32· New lines for 2026, old result not shown
- California District 33· New lines for 2026, old result not shown
- California District 34· Jimmy Gomez (D), Democratic by 11.2 points, 2024
- California District 35· New lines for 2026, old result not shown
- California District 36· Ted Lieu (D), Democratic by 37.4 points, 2024
- California District 37· Sydney Kamlager-Dove (D), Democratic by 56.6 points, 2024
- California District 38· New lines for 2026, old result not shown
- California District 39· New lines for 2026, old result not shown
- California District 40· New lines for 2026, old result not shown
- California District 41· New lines for 2026, old result not shown
- California District 42· New lines for 2026, old result not shown
- California District 43· Maxine Waters (D), Democratic by 50.2 points, 2024
- California District 44· New lines for 2026, old result not shown
- California District 45· New lines for 2026, old result not shown
- California District 46· New lines for 2026, old result not shown
- California District 47· New lines for 2026, old result not shown
- California District 48· New lines for 2026, old result not shown
- California District 49· New lines for 2026, old result not shown
- California District 50· New lines for 2026, old result not shown
- California District 51· New lines for 2026, old result not shown
- California District 52· New lines for 2026, old result not shown
Map settings
Vote in California
Trouble voting? Election Protection hotline: 866-OUR-VOTE. A nonpartisan coalition of civil-rights and voting-rights groups, not a government service. 866ourvote.org
Official results for California
History (25 elections for this seat)
- Votes for listed candidates
- 233,555
- Election day
- November 5, 2024
- District map
- Older district map (2022 to 2025)
US House, California District 35, 2024, every candidate Candidate Party Votes and share Share DemocraticNorma J. TorresWon Democratic 136,41358.4% RepublicanMike Cargile Republican 97,14241.6% - Votes for listed candidates
- 130,953
- Election day
- November 8, 2022
- District map
- Older district map (2022 to 2025)
US House, California District 35, 2022, every candidate Candidate Party Votes and share Share DemocraticNorma J. TorresWon Democratic 75,12157.4% RepublicanMike Cargile Republican 55,83242.6% - Votes for listed candidates
- 244,346
- Election day
- November 3, 2020
- District map
- Older district map (2012 to 2020)
US House, California District 35, 2020, every candidate Candidate Party Votes and share Share DemocraticNorma J. TorresWon Democratic 169,40569.3% RepublicanMike Cargile Republican 74,94130.7% - Votes for listed candidates
- 149,024
- Election day
- November 6, 2018
- District map
- Older district map (2012 to 2020)
US House, California District 35, 2018, every candidate Candidate Party Votes and share Share DemocraticNorma J. TorresWon Democratic 103,42069.4% RepublicanChristian Leonel Valiente Republican 45,60430.6% - Votes for listed candidates
- 171,353
- Election day
- November 8, 2016
- District map
- Older district map (2012 to 2020)
US House, California District 35, 2016, every candidate Candidate Party Votes and share Share DemocraticNorma J. TorresWon Democratic 124,04472.4% RepublicanTyler Fischella Republican 47,30927.6% - Votes for listed candidates
- 62,255
- Election day
- November 4, 2014
- District map
- Older district map (2012 to 2020)
US House, California District 35, 2014, every candidate Candidate Party Votes and share Share DemocraticNorma J. TorresWon Democratic 39,50263.5% DemocraticChristina Gagnier Democratic 22,75336.5% - Votes for listed candidates
- 142,680
- Election day
- November 6, 2012
- District map
- Older district map (2012 to 2020)
US House, California District 35, 2012, every candidate Candidate Party Votes and share Share DemocraticGloria Negrete McLeodWon Democratic 79,69855.9% DemocraticJoe Baca Democratic 62,98244.1% - Votes for listed candidates
- 123,694
- Election day
- November 2, 2010
- District map
- Older district map (2002 to 2010)
US House, California District 35, 2010, every candidate Candidate Party Votes and share Share DemocraticMaxine WatersWon Democratic 98,13179.3% RepublicanK Bruce Brown Republican 25,56120.7% Scattered write-insName as filed: Writein Write-in 20.0% - Votes for listed candidates
- 182,579
- Election day
- November 4, 2008
- District map
- Older district map (2002 to 2010)
US House, California District 35, 2008, every candidate Candidate Party Votes and share Share DemocraticMaxine WatersWon Democratic 150,77882.6% RepublicanTed Hayes Republican 24,16913.2% LibertarianHerb Peters Libertarian 7,6324.2% - Votes for listed candidates
- 98,506
- Election day
- November 7, 2006
- District map
- Older district map (2002 to 2010)
US House, California District 35, 2006, every candidate Candidate Party Votes and share Share DemocraticMaxine WatersWon Democratic 82,49883.7% IndependentGordon Michael Mego Independent 8,3438.5% LibertarianPaul T Ireland Libertarian 7,6657.8% - Votes for listed candidates
- 156,407
- Election day
- November 2, 2004
- District map
- Older district map (2002 to 2010)
US House, California District 35, 2004, every candidate Candidate Party Votes and share Share DemocraticMaxine WatersWon Democratic 125,94980.5% RepublicanRoss Moen Republican 23,59115.1% OtherGordon Michael Mego Other 3,4402.2% LibertarianCharles Tate Libertarian 3,4272.2% - Votes for listed candidates
- 93,407
- Election day
- November 5, 2002
- District map
- Older district map (2002 to 2010)
US House, California District 35, 2002, every candidate Candidate Party Votes and share Share DemocraticMaxine WatersWon Democratic 72,40177.5% RepublicanRoss Moen Republican 18,09419.4% OtherGordon Michael Mego Other 2,9123.1% - Votes for listed candidates
- 116,215
- Election day
- November 7, 2000
- District map
- Older district map (1992 to 2000)
US House, California District 35, 2000, every candidate Candidate Party Votes and share Share DemocraticMaxine WatersWon Democratic 100,56986.5% RepublicanCarl McGill Republican 12,58210.8% OtherGordon Michael Mego Other 1,9111.6% OtherRick Joseph Dunstan Other 1,1531.0% - Votes for listed candidates
- 88,145
- Election day
- November 3, 1998
- District map
- Older district map (1992 to 2000)
US House, California District 35, 1998, every candidate Candidate Party Votes and share Share DemocraticMaxine WatersWon Democratic 78,73289.3% OtherGordon Michael Mego Other 9,41310.7% - Votes for listed candidates
- 108,488
- Election day
- November 5, 1996
- District map
- Older district map (1992 to 2000)
US House, California District 35, 1996, every candidate Candidate Party Votes and share Share DemocraticMaxine WatersWon Democratic 92,76285.5% RepublicanEric Carlson Republican 13,11612.1% OtherGordon Michael Mego Other 2,6102.4% - Votes for listed candidates
- 84,081
- Election day
- November 8, 1994
- District map
- Older district map (1992 to 2000)
US House, California District 35, 1994, every candidate Candidate Party Votes and share Share DemocraticMaxine WatersWon Democratic 65,68878.1% RepublicanNate Truman Republican 18,39021.9% Scattered write-insName as filed: Writein Write-in 30.0% - Votes for listed candidates
- 124,776
- Election day
- November 3, 1992
- District map
- Older district map (1992 to 2000)
US House, California District 35, 1992, every candidate Candidate Party Votes and share Share DemocraticMaxine WatersWon Democratic 102,94182.5% RepublicanNate Truman Republican 17,41714.0% OtherAlice Mae Miles Other 2,7972.2% LibertarianCarin Rogers Libertarian 1,6181.3% Scattered write-insName as filed: Writein Write-in 30.0% - Votes for listed candidates
- 200,722
- Election day
- November 6, 1990
- District map
- Older district map (1982 to 1990)
US House, California District 35, 1990, every candidate Candidate Party Votes and share Share RepublicanJerry LewisWon Republican 121,60260.6% DemocraticBarry Norton Democratic 66,10032.9% LibertarianJerry Johnson Libertarian 13,0206.5% - Votes for listed candidates
- 257,268
- Election day
- November 8, 1988
- District map
- Older district map (1982 to 1990)
US House, California District 35, 1988, every candidate Candidate Party Votes and share Share RepublicanJerry LewisWon Republican 181,20370.4% DemocraticPaul Sweeney Democratic 71,18627.7% LibertarianJeff Shuman Libertarian 4,8791.9% - Votes for listed candidates
- 165,557
- Election day
- November 4, 1986
- District map
- Older district map (1982 to 1990)
US House, California District 35, 1986, every candidate Candidate Party Votes and share Share RepublicanJerry LewisWon Republican 127,23576.9% DemocraticR "Sarge" Hall Democratic 38,32223.1% - Votes for listed candidates
- 206,467
- Election day
- November 6, 1984
- District map
- Older district map (1982 to 1990)
US House, California District 35, 1984, every candidate Candidate Party Votes and share Share RepublicanJerry LewisWon Republican 176,47785.5% OtherKevin Akin Other 29,99014.5% - Votes for listed candidates
- 165,135
- Election day
- November 2, 1982
- District map
- Older district map (1982 to 1990)
US House, California District 35, 1982, every candidate Candidate Party Votes and share Share RepublicanJerry LewisWon Republican 112,78668.3% DemocraticRobert E Erwin Democratic 52,34931.7% - Votes for listed candidates
- 194,514
- Election day
- November 4, 1980
- District map
- Older district map (1972 to 1980)
US House, California District 35, 1980, every candidate Candidate Party Votes and share Share RepublicanDave DreierWon Republican 100,74351.8% DemocraticJim Lloyd Democratic 88,27945.4% OtherJames Michael "Mike" Noonan Other 5,4922.8% - Votes for listed candidates
- 148,830
- Election day
- November 7, 1978
- District map
- Older district map (1972 to 1980)
US House, California District 35, 1978, every candidate Candidate Party Votes and share Share DemocraticJim LloydWon Democratic 80,38854.0% RepublicanDavid Dreier Republican 68,44246.0% - Votes for listed candidates
- 164,237
- Election day
- November 2, 1976
- District map
- Older district map (1972 to 1980)
US House, California District 35, 1976, every candidate Candidate Party Votes and share Share DemocraticJim LloydWon Democratic 87,47253.3% RepublicanLouis Brutocao Republican 76,76546.7%
1976 to 2024: MIT Election Data and Science Lab, U.S. House 1976-2024, retrieved Oct 28, 2026. Compiled by MIT Election Data and Science Lab (MEDSL) from official returns; not an official source
California District 35 was redrawn for 2026, so every row here ran on older lines and covers different territory. The map in force, by state
Download and cite
Cite this page
Election Wrld. (2026). California District 35, US House results. https://www.electionwrld.com/ca/congress/35. Retrieved October 30, 2026.
Embed this seat
<iframe src="https://www.electionwrld.com/embed/ca/congress/35" title="California District 35, US House" width="100%" height="400" style="border:0;max-width:640px" loading="lazy"></iframe>
<p style="font-size:13px">Data: <a href="https://www.electionwrld.com">Election Wrld</a>, CC BY 4.0</p>Sources
Sources: MIT Election Data and Science Lab, U.S. House 1976-2024 (CC0 1.0), retrieved Oct 28, 2026, compiled by MIT Election Data and Science Lab (MEDSL) from official returns, not an official source; Census TIGERweb Legislative MapServer (120th CDs layer 0, 119th CDs layer 4, 2026 SLD upper layer 1 and lower layer 2) (US Census Bureau, public domain), retrieved Oct 28, 2026; unitedstates/congress-legislators (current) (CC0-1.0), retrieved Oct 28, 2026, compiled by the @unitedstates project volunteers (rosters from official congressional sources) from official returns, not an official source.
DataState data (JSON)Sources: MIT Election Data and Science Lab, U.S. House 1976-2024, FEC, DIME (ODC-BY), Portraits: unitedstates/images (public domain), Photo creditsData as of Oct 28, 2026