

California District 11
Tue, Nov 3 · Seat held by Nancy Pelosi Democratic since Jan 1987 (not a candidate in 2026)
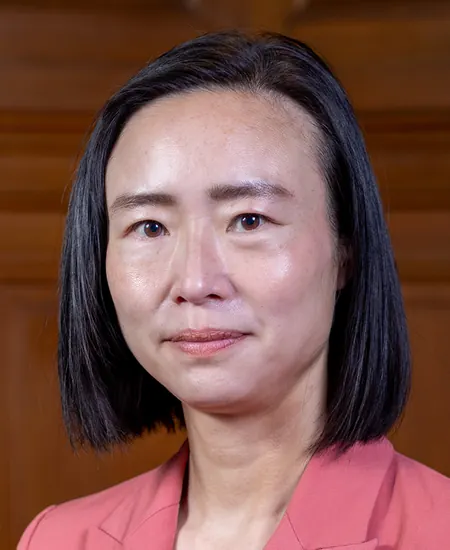
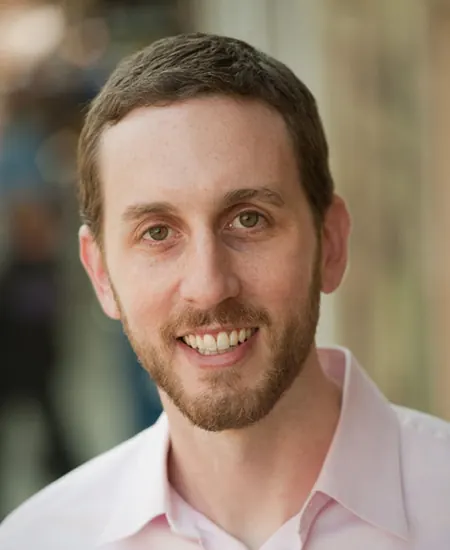
Connie Chan 37.5Scott Wiener 46.0
Average of 2 polls, Sep 15 to Oct 19, from VoteHub · how it’s calculated
Newest poll
1 is a partisan pollNewest · University of Southern California Democracy and Fair Elections Lab, field dates Oct 16 to Oct 19, released Oct 22, 454 likely votersPolls updated Oct 30, 7:30 p.m. ET, from VoteHub
- Last election
- Nancy Pelosi (Democratic) won by 62.0 points, 2024
- Margin since 2022
- 6.0 points toward Republicans
- On the 2026 ballot
- 2 candidates, open seat
Polls over time
2 polls, through Election Day Nov 3The thick line is the 7-week average, not a forecast. How it’s calculated. All polls. Polls updated Oct 30, 7:30 p.m. ET, from VoteHub.
The polls in this chart (2)
1 poll released in the last 14 days · latest results range from 34 to 41% (Chan) and 45 to 47% (Wiener) (newest 2 polls on the chart)
2 of the 2 polls for this race, each with both names, plotted on the field end date.
| Pollster | Field dates | Released | Sample | Chan | Wiener |
|---|---|---|---|---|---|
| University of Southern California Democracy and Fair Elections Lab | Oct 16 to Oct 19 | Oct 22 | 454 likely voters | 41 | 47 |
| Tavern Research | Sep 15 to Sep 17 | Oct 2 | 658 likely voters | 34 | 45 |
Side by side
Left column: ChanRight column: Wiener
- Total receipts, 2025-2026 cycle, through Oct 14
- $2.4M
- $5.8M
- Cash on hand
- $582K
- $611K
- Donor-based spectrum
- LiberalCentristConservativeWienerNo published score for Chan
- Races
- None listed
- Won 3 of 3
- Years since first win
- Not available
- 10
- Age on Election Day
- 48
- 56
Money: FEC bulk data, through Oct 14. One or more are matched to the FEC by name, party and seat, so a total could belong to someone else.
How these are counted
Total receipts line of each candidate’s principal campaign committee, 2025-2026 cycle. Other sites may show career, six-year or all-committee totals, which differ. Chan: $2,404,664 received, $581,805 cash on hand. Wiener: $5,808,855 received, $611,039 cash on hand. The spectrum is a published research score, not our rating. How this works. Wins and losses count the races in our results files, the same as each profile.
What changed in this race
Newest firstNEW POLLCalifornia District 11
California District 11: Scott Wiener 51, Connie Chan 44
University of Southern California Democracy and Fair Elections Lab, Oct 16 to Oct 19, 454 likely voters
More about this race
Candidates on the ballot
Open seat
The current holder, Nancy Pelosi, is not on the candidate list.
- Connie ChanDemocraticSan Francisco Supervisor
- Scott WienerDemocraticState Senator
Source: elections.cdn.sos.ca.gov (PDF), dated Aug 27
Shift since 2022: 6.0 points toward Republicans (Democratic by 68.0 in 2022, Democratic by 62.0 in 2024).
All California districts
- D 15+ pts
- D 5 to 15 pts
- D under 5 pts
- R under 5 pts
- R 5 to 15 pts
- R 15+ pts
- Other winner
- No data
Show these districts as a list (52)
- California District 1· New lines for 2026, old result not shown
- California District 2· New lines for 2026, old result not shown
- California District 3· New lines for 2026, old result not shown
- California District 4· New lines for 2026, old result not shown
- California District 5· New lines for 2026, old result not shown
- California District 6· New lines for 2026, old result not shown
- California District 7· New lines for 2026, old result not shown
- California District 8· New lines for 2026, old result not shown
- California District 9· New lines for 2026, old result not shown
- California District 10· New lines for 2026, old result not shown
- California District 11· Nancy Pelosi (D), Democratic by 62.0 points, 2024
- California District 12· Lateefah Simon (D), Democratic by 30.8 points, 2024
- California District 13· New lines for 2026, old result not shown
- California District 14· New lines for 2026, old result not shown
- California District 15· Kevin Mullin (D), Democratic by 46.2 points, 2024
- California District 16· New lines for 2026, old result not shown
- California District 17· New lines for 2026, old result not shown
- California District 18· New lines for 2026, old result not shown
- California District 19· Jimmy Panetta (D), Democratic by 38.6 points, 2024
- California District 20· New lines for 2026, old result not shown
- California District 21· New lines for 2026, old result not shown
- California District 22· New lines for 2026, old result not shown
- California District 23· New lines for 2026, old result not shown
- California District 24· New lines for 2026, old result not shown
- California District 25· New lines for 2026, old result not shown
- California District 26· New lines for 2026, old result not shown
- California District 27· New lines for 2026, old result not shown
- California District 28· New lines for 2026, old result not shown
- California District 29· New lines for 2026, old result not shown
- California District 30· New lines for 2026, old result not shown
- California District 31· New lines for 2026, old result not shown
- California District 32· New lines for 2026, old result not shown
- California District 33· New lines for 2026, old result not shown
- California District 34· Jimmy Gomez (D), Democratic by 11.2 points, 2024
- California District 35· New lines for 2026, old result not shown
- California District 36· Ted Lieu (D), Democratic by 37.4 points, 2024
- California District 37· Sydney Kamlager-Dove (D), Democratic by 56.6 points, 2024
- California District 38· New lines for 2026, old result not shown
- California District 39· New lines for 2026, old result not shown
- California District 40· New lines for 2026, old result not shown
- California District 41· New lines for 2026, old result not shown
- California District 42· New lines for 2026, old result not shown
- California District 43· Maxine Waters (D), Democratic by 50.2 points, 2024
- California District 44· New lines for 2026, old result not shown
- California District 45· New lines for 2026, old result not shown
- California District 46· New lines for 2026, old result not shown
- California District 47· New lines for 2026, old result not shown
- California District 48· New lines for 2026, old result not shown
- California District 49· New lines for 2026, old result not shown
- California District 50· New lines for 2026, old result not shown
- California District 51· New lines for 2026, old result not shown
- California District 52· New lines for 2026, old result not shown
Map settings
Vote in California
Trouble voting? Election Protection hotline: 866-OUR-VOTE. A nonpartisan coalition of civil-rights and voting-rights groups, not a government service. 866ourvote.org
Official results for California
History (25 elections for this seat)
- Votes for listed candidates
- 339,111
- Election day
- November 5, 2024
- District map
- Same as today
US House, California District 11, 2024, every candidate Candidate Party Votes and share Share DemocraticNancy PelosiWon Democratic 274,79681.0% RepublicanBruce Lou Republican 64,31519.0% - Votes for listed candidates
- 263,065
- Election day
- November 8, 2022
- District map
- Same as today
US House, California District 11, 2022, every candidate Candidate Party Votes and share Share DemocraticNancy PelosiWon Democratic 220,84884.0% RepublicanJohn Dennis Republican 42,21716.0% - Votes for listed candidates
- 371,356
- Election day
- November 3, 2020
- District map
- Older district map (2012 to 2020)
US House, California District 11, 2020, every candidate Candidate Party Votes and share Share DemocraticMark DeSaulnierWon Democratic 271,06373.0% RepublicanNisha Sharma Republican 100,29327.0% - Votes for listed candidates
- 275,681
- Election day
- November 6, 2018
- District map
- Older district map (2012 to 2020)
US House, California District 11, 2018, every candidate Candidate Party Votes and share Share DemocraticMark DeSaulnierWon Democratic 204,36974.1% RepublicanJohn Fitzgerald Republican 71,31225.9% - Votes for listed candidates
- 298,209
- Election day
- November 8, 2016
- District map
- Older district map (2012 to 2020)
US House, California District 11, 2016, every candidate Candidate Party Votes and share Share DemocraticMark DeSaulnierWon Democratic 214,86872.1% RepublicanRoger Allen Petersen Republican 83,34127.9% - Votes for listed candidates
- 174,662
- Election day
- November 4, 2014
- District map
- Older district map (2012 to 2020)
US House, California District 11, 2014, every candidate Candidate Party Votes and share Share DemocraticMark DeSaulnierWon Democratic 117,50267.3% RepublicanTue Phan Republican 57,16032.7% - Votes for listed candidates
- 287,879
- Election day
- November 6, 2012
- District map
- Older district map (2012 to 2020)
US House, California District 11, 2012, every candidate Candidate Party Votes and share Share DemocraticGeorge MillerWon Democratic 200,74369.7% RepublicanVirginia Fuller Republican 87,13630.3% - Votes for listed candidates
- 240,503
- Election day
- November 2, 2010
- District map
- Older district map (2002 to 2010)
US House, California District 11, 2010, every candidate Candidate Party Votes and share Share DemocraticJerry McNerneyWon Democratic 115,36148.0% RepublicanDavid Harmer Republican 112,70346.9% OtherDavid Christiensen Other 12,4395.2% - Votes for listed candidates
- 297,616
- Election day
- November 4, 2008
- District map
- Older district map (2002 to 2010)
US House, California District 11, 2008, every candidate Candidate Party Votes and share Share DemocraticJerry McNerneyWon Democratic 164,50055.3% RepublicanDean Andal Republican 133,10444.7% Scattered write-insName as filed: Writein Write-in 120.0% - Votes for listed candidates
- 206,264
- Election day
- November 7, 2006
- District map
- Older district map (2002 to 2010)
US House, California District 11, 2006, every candidate Candidate Party Votes and share Share DemocraticJerry McNerneyWon Democratic 109,86853.3% RepublicanRichard W Pombo Republican 96,39646.7% - Votes for listed candidates
- 267,169
- Election day
- November 2, 2004
- District map
- Older district map (2002 to 2010)
US House, California District 11, 2004, every candidate Candidate Party Votes and share Share RepublicanRichard W PomboWon Republican 163,58261.2% DemocraticGerald "Jerry" M McNerney Democratic 103,58738.8% - Votes for listed candidates
- 173,956
- Election day
- November 5, 2002
- District map
- Older district map (2002 to 2010)
US House, California District 11, 2002, every candidate Candidate Party Votes and share Share RepublicanRichard W PomboWon Republican 104,92160.3% DemocraticElaine Shaw Democratic 69,03539.7% - Votes for listed candidates
- 208,607
- Election day
- November 7, 2000
- District map
- Older district map (1992 to 2000)
US House, California District 11, 2000, every candidate Candidate Party Votes and share Share RepublicanRichard W PomboWon Republican 120,63557.8% DemocraticTom Y Santos Democratic 79,53938.1% LibertarianKathryn A Russow Libertarian 5,0362.4% OtherJon A Kurey Other 3,3971.6% - Votes for listed candidates
- 155,449
- Election day
- November 3, 1998
- District map
- Older district map (1992 to 2000)
US House, California District 11, 1998, every candidate Candidate Party Votes and share Share RepublicanRichard W PomboWon Republican 95,49661.4% DemocraticRobert L Figueroa Democratic 56,34536.2% LibertarianJesse Baird Libertarian 3,6082.3% - Votes for listed candidates
- 181,096
- Election day
- November 5, 1996
- District map
- Older district map (1992 to 2000)
US House, California District 11, 1996, every candidate Candidate Party Votes and share Share RepublicanRichard W PomboWon Republican 107,47759.3% DemocraticJason Silva Democratic 65,53636.2% LibertarianKelly Rego Libertarian 5,0772.8% OtherSelene L Bush Other 3,0061.7% - Votes for listed candidates
- 159,814
- Election day
- November 8, 1994
- District map
- Older district map (1992 to 2000)
US House, California District 11, 1994, every candidate Candidate Party Votes and share Share RepublicanRichard W PomboWon Republican 99,30262.1% DemocraticRandy A Perry Democratic 55,79434.9% LibertarianJoseph B Miller Libertarian 4,7183.0% - Votes for listed candidates
- 198,490
- Election day
- November 3, 1992
- District map
- Older district map (1992 to 2000)
US House, California District 11, 1992, every candidate Candidate Party Votes and share Share RepublicanRichard W PomboWon Republican 94,45347.6% DemocraticPatricia Garamendi Democratic 90,53945.6% LibertarianChristine Roberts Libertarian 13,4986.8% - Votes for listed candidates
- 159,365
- Election day
- November 6, 1990
- District map
- Older district map (1982 to 1990)
US House, California District 11, 1990, every candidate Candidate Party Votes and share Share DemocraticTom LantosWon Democratic 105,02965.9% RepublicanBill Quraishi Republican 45,81828.8% LibertarianJune R Genis Libertarian 8,5185.3% - Votes for listed candidates
- 205,016
- Election day
- November 8, 1988
- District map
- Older district map (1982 to 1990)
US House, California District 11, 1988, every candidate Candidate Party Votes and share Share DemocraticTom LantosWon Democratic 145,48471.0% RepublicanG M "Bill" Quraishi Republican 50,05024.4% LibertarianBill Wade Libertarian 4,6832.3% OtherVictor Martinez Other 2,9061.4% IndependentNicholas W Kurdrovzeff Independent 1,8930.9% - Votes for listed candidates
- 151,695
- Election day
- November 4, 1986
- District map
- Older district map (1982 to 1990)
US House, California District 11, 1986, every candidate Candidate Party Votes and share Share DemocraticTom LantosWon Democratic 112,38074.1% RepublicanG M "Bill" Quraishi Republican 39,31525.9% - Votes for listed candidates
- 211,115
- Election day
- November 6, 1984
- District map
- Older district map (1982 to 1990)
US House, California District 11, 1984, every candidate Candidate Party Votes and share Share DemocraticTom LantosWon Democratic 147,60769.9% RepublicanJohn J "Jack" Hickey Republican 59,62528.2% OtherNicholas W Kudrovzeff Other 3,8831.8% - Votes for listed candidates
- 192,372
- Election day
- November 2, 1982
- District map
- Older district map (1982 to 1990)
US House, California District 11, 1982, every candidate Candidate Party Votes and share Share DemocraticTom LantosWon Democratic 109,81257.1% RepublicanBill Royer Republican 76,46239.7% LibertarianChuck Olson Libertarian 2,9201.5% OtherWilson Branch Other 1,9281.0% OtherNicholas W Kudrovzeff Other 1,2500.6% - Votes for listed candidates
- 185,012
- Election day
- November 4, 1980
- District map
- Older district map (1972 to 1980)
US House, California District 11, 1980, every candidate Candidate Party Votes and share Share DemocraticTom LantosWon Democratic 85,82346.4% RepublicanBill Royer Republican 80,10043.3% OtherWilson Branch Other 13,7237.4% LibertarianWilliam S Wade Jr Libertarian 3,8162.1% OtherNicholas W Kudrovzeff Other 1,5500.8% - Votes for listed candidates
- 153,464
- Election day
- November 7, 1978
- District map
- Older district map (1972 to 1980)
US House, California District 11, 1978, every candidate Candidate Party Votes and share Share DemocraticLeo J RyanWon Democratic 92,88260.5% RepublicanDave Welch Republican 54,62135.6% OtherNicholas Waeil Kudrovzeff Other 5,9613.9% - Votes for listed candidates
- 176,194
- Election day
- November 2, 1976
- District map
- Older district map (1972 to 1980)
US House, California District 11, 1976, every candidate Candidate Party Votes and share Share DemocraticLeo J RyanWon Democratic 107,61861.1% RepublicanBob Jones Republican 62,43535.4% OtherNicholas W Kudrovzeff Other 6,1413.5%
1976 to 2024: MIT Election Data and Science Lab, U.S. House 1976-2024, retrieved Oct 28, 2026. Compiled by MIT Election Data and Science Lab (MEDSL) from official returns; not an official source
District numbers are reused after each redistricting, so rows on older lines cover different territory than today's California District 11.
Download and cite
Cite this page
Election Wrld. (2026). California District 11, US House results. https://www.electionwrld.com/ca/congress/11. Retrieved October 30, 2026.
Embed this seat
<iframe src="https://www.electionwrld.com/embed/ca/congress/11" title="California District 11, US House" width="100%" height="400" style="border:0;max-width:640px" loading="lazy"></iframe>
<p style="font-size:13px">Data: <a href="https://www.electionwrld.com">Election Wrld</a>, CC BY 4.0</p>Sources
Sources: MIT Election Data and Science Lab, U.S. House 1976-2024 (CC0 1.0), retrieved Oct 28, 2026, compiled by MIT Election Data and Science Lab (MEDSL) from official returns, not an official source; Census TIGERweb Legislative MapServer (120th CDs layer 0, 119th CDs layer 4, 2026 SLD upper layer 1 and lower layer 2) (US Census Bureau, public domain), retrieved Oct 28, 2026; unitedstates/congress-legislators (current) (CC0-1.0), retrieved Oct 28, 2026, compiled by the @unitedstates project volunteers (rosters from official congressional sources) from official returns, not an official source.
DataState data (JSON)Sources: MIT Election Data and Science Lab, U.S. House 1976-2024, VoteHub polls (CC BY 4.0), FEC, DIME (ODC-BY), Photo creditsData as of Oct 30, 2026 (candidate list Oct 28, 2026)