

California District 5
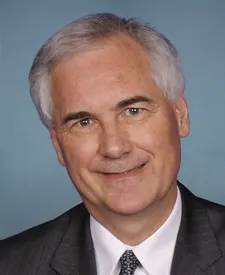
Tue, Nov 3 · Sitting member, elected on the old lines Tom McClintock Republican since Jan 2009
No published poll names both candidates.District lines changed for 2026. Results from the old lines aren't shown.
- Lines for 2026
- Redrawn. 27.1% of residents were in a different district in 2024
- On the 2026 ballot
- 2 candidates
Side by side
Left column: MasudaRight column: McClintock
- Total receipts, 2025-2026 cycle, through Oct 14
- $582K
- $1.3M
- Cash on hand
- $60K
- $314K
- Donor-based spectrum
- LiberalCentristConservativeMcClintockNo published score for Masuda
- Races
- None listed
- Won 13 of 16
- Years since first win
- Not available
- 17
- Age on Election Day
- Not available
- 70
Money: FEC bulk data, through Oct 14. One or more are matched to the FEC by name, party and seat, so a total could belong to someone else.
How these are counted
Total receipts line of each candidate’s principal campaign committee, 2025-2026 cycle. Other sites may show career, six-year or all-committee totals, which differ. Masuda: $581,621 received, $59,666 cash on hand. McClintock: $1,254,442 received, $314,100 cash on hand. The spectrum is a published research score, not our rating. How this works. Wins and losses count the races in our results files, the same as each profile.
More about this race
Candidates on the ballot
- Michael MasudaDemocraticForeign Affairs Officer
- Tom McClintockIncumbentRepublicanUnited States Representative
Source: elections.cdn.sos.ca.gov (PDF), dated Aug 27
All California districts
- D 15+ pts
- D 5 to 15 pts
- D under 5 pts
- R under 5 pts
- R 5 to 15 pts
- R 15+ pts
- Other winner
- No data
Show these districts as a list (52)
- California District 1· New lines for 2026, old result not shown
- California District 2· New lines for 2026, old result not shown
- California District 3· New lines for 2026, old result not shown
- California District 4· New lines for 2026, old result not shown
- California District 5· New lines for 2026, old result not shown
- California District 6· New lines for 2026, old result not shown
- California District 7· New lines for 2026, old result not shown
- California District 8· New lines for 2026, old result not shown
- California District 9· New lines for 2026, old result not shown
- California District 10· New lines for 2026, old result not shown
- California District 11· Nancy Pelosi (D), Democratic by 62.0 points, 2024
- California District 12· Lateefah Simon (D), Democratic by 30.8 points, 2024
- California District 13· New lines for 2026, old result not shown
- California District 14· New lines for 2026, old result not shown
- California District 15· Kevin Mullin (D), Democratic by 46.2 points, 2024
- California District 16· New lines for 2026, old result not shown
- California District 17· New lines for 2026, old result not shown
- California District 18· New lines for 2026, old result not shown
- California District 19· Jimmy Panetta (D), Democratic by 38.6 points, 2024
- California District 20· New lines for 2026, old result not shown
- California District 21· New lines for 2026, old result not shown
- California District 22· New lines for 2026, old result not shown
- California District 23· New lines for 2026, old result not shown
- California District 24· New lines for 2026, old result not shown
- California District 25· New lines for 2026, old result not shown
- California District 26· New lines for 2026, old result not shown
- California District 27· New lines for 2026, old result not shown
- California District 28· New lines for 2026, old result not shown
- California District 29· New lines for 2026, old result not shown
- California District 30· New lines for 2026, old result not shown
- California District 31· New lines for 2026, old result not shown
- California District 32· New lines for 2026, old result not shown
- California District 33· New lines for 2026, old result not shown
- California District 34· Jimmy Gomez (D), Democratic by 11.2 points, 2024
- California District 35· New lines for 2026, old result not shown
- California District 36· Ted Lieu (D), Democratic by 37.4 points, 2024
- California District 37· Sydney Kamlager-Dove (D), Democratic by 56.6 points, 2024
- California District 38· New lines for 2026, old result not shown
- California District 39· New lines for 2026, old result not shown
- California District 40· New lines for 2026, old result not shown
- California District 41· New lines for 2026, old result not shown
- California District 42· New lines for 2026, old result not shown
- California District 43· Maxine Waters (D), Democratic by 50.2 points, 2024
- California District 44· New lines for 2026, old result not shown
- California District 45· New lines for 2026, old result not shown
- California District 46· New lines for 2026, old result not shown
- California District 47· New lines for 2026, old result not shown
- California District 48· New lines for 2026, old result not shown
- California District 49· New lines for 2026, old result not shown
- California District 50· New lines for 2026, old result not shown
- California District 51· New lines for 2026, old result not shown
- California District 52· New lines for 2026, old result not shown
Map settings
Vote in California
Trouble voting? Election Protection hotline: 866-OUR-VOTE. A nonpartisan coalition of civil-rights and voting-rights groups, not a government service. 866ourvote.org
Official results for California
History (25 elections for this seat)
- Votes for listed candidates
- 368,562
- Election day
- November 5, 2024
- District map
- Older district map (2022 to 2025)
US House, California District 5, 2024, every candidate Candidate Party Votes and share Share RepublicanTom McClintockWon Republican 227,64361.8% DemocraticMichael J. "Mike" Barkley Democratic 140,91938.2% - Votes for listed candidates
- 283,030
- Election day
- November 8, 2022
- District map
- Older district map (2022 to 2025)
US House, California District 5, 2022, every candidate Candidate Party Votes and share Share RepublicanTom McClintockWon Republican 173,52461.3% DemocraticMichael J. "Mike" Barkley Democratic 109,50638.7% - Votes for listed candidates
- 356,460
- Election day
- November 3, 2020
- District map
- Older district map (2012 to 2020)
US House, California District 5, 2020, every candidate Candidate Party Votes and share Share DemocraticMike ThompsonWon Democratic 271,23376.1% RepublicanScott Giblin Republican 85,22723.9% - Votes for listed candidates
- 261,018
- Election day
- November 6, 2018
- District map
- Older district map (2012 to 2020)
US House, California District 5, 2018, every candidate Candidate Party Votes and share Share DemocraticMike ThompsonWon Democratic 205,86078.9% IndependentAnthony Mills Independent 55,15821.1% - Votes for listed candidates
- 292,091
- Election day
- November 8, 2016
- District map
- Older district map (2012 to 2020)
US House, California District 5, 2016, every candidate Candidate Party Votes and share Share DemocraticMike ThompsonWon Democratic 224,52676.9% RepublicanCarlos Santamaria Republican 67,56523.1% - Votes for listed candidates
- 171,148
- Election day
- November 4, 2014
- District map
- Older district map (2012 to 2020)
US House, California District 5, 2014, every candidate Candidate Party Votes and share Share DemocraticMike ThompsonWon Democratic 129,61375.7% IndependentJames Hinton Independent 41,53524.3% - Votes for listed candidates
- 272,417
- Election day
- November 6, 2012
- District map
- Older district map (2012 to 2020)
US House, California District 5, 2012, every candidate Candidate Party Votes and share Share DemocraticMike ThompsonWon Democratic 202,87274.5% RepublicanRandy Loftin Republican 69,54525.5% - Votes for listed candidates
- 172,410
- Election day
- November 2, 2010
- District map
- Older district map (2002 to 2010)
US House, California District 5, 2010, every candidate Candidate Party Votes and share Share DemocraticDoris O. MatsuiWon Democratic 124,22072.0% RepublicanPaul A Smith Republican 43,57725.3% OtherGerald Allen Frink Other 4,5942.7% Scattered write-insName as filed: Writein Write-in 190.0% - Votes for listed candidates
- 221,155
- Election day
- November 4, 2008
- District map
- Older district map (2002 to 2010)
US House, California District 5, 2008, every candidate Candidate Party Votes and share Share DemocraticDoris O. MatsuiWon Democratic 164,24274.3% RepublicanPaul A Smith Republican 46,00220.8% OtherL R Roberts Other 10,7314.9% Scattered write-insName as filed: Writein Write-in 1800.1% - Votes for listed candidates
- 149,266
- Election day
- November 7, 2006
- District map
- Older district map (2002 to 2010)
US House, California District 5, 2006, every candidate Candidate Party Votes and share Share DemocraticDoris O. MatsuiWon Democratic 105,67670.8% RepublicanClaire Yan Republican 35,10623.5% GreenJeff Kravitz Green 6,4664.3% OtherJohn C Reiger Other 2,0181.4% - Votes for listed candidates
- 193,387
- Election day
- November 2, 2004
- District map
- Older district map (2002 to 2010)
US House, California District 5, 2004, every candidate Candidate Party Votes and share Share DemocraticRobert T MatsuiWon Democratic 138,00471.4% RepublicanMike Dugas Republican 45,12023.3% GreenPat Driscoll Green 6,5933.4% OtherJohn C Reiger Other 3,6701.9% - Votes for listed candidates
- 131,578
- Election day
- November 5, 2002
- District map
- Older district map (2002 to 2010)
US House, California District 5, 2002, every candidate Candidate Party Votes and share Share DemocraticRobert T MatsuiWon Democratic 92,72670.5% RepublicanRichard Frankhuizen Republican 34,74926.4% LibertarianTimothy E Roloff Libertarian 4,1033.1% - Votes for listed candidates
- 214,059
- Election day
- November 7, 2000
- District map
- Older district map (1992 to 2000)
US House, California District 5, 2000, every candidate Candidate Party Votes and share Share DemocraticRobert T MatsuiWon Democratic 147,02568.7% RepublicanKenneth J Payne Republican 55,94526.1% GreenKen Adams Green 6,1952.9% LibertarianCullene Lang Libertarian 2,9191.4% OtherCharles Kersey Other 1,9750.9% - Votes for listed candidates
- 181,768
- Election day
- November 3, 1998
- District map
- Older district map (1992 to 2000)
US House, California District 5, 1998, every candidate Candidate Party Votes and share Share DemocraticRobert T MatsuiWon Democratic 130,71571.9% RepublicanRobert S Dinsmore Republican 47,30726.0% LibertarianDouglas Arthur Tuma Libertarian 3,7462.1% - Votes for listed candidates
- 202,460
- Election day
- November 5, 1996
- District map
- Older district map (1992 to 2000)
US House, California District 5, 1996, every candidate Candidate Party Votes and share Share DemocraticRobert T MatsuiWon Democratic 142,61870.4% RepublicanRobert S Dinsmore Republican 52,94026.1% LibertarianJoseph B Miller Libertarian 2,5481.3% OtherGordon Mors Other 2,2311.1% OtherCharles Kersey Other 2,1231.0% - Votes for listed candidates
- 182,596
- Election day
- November 8, 1994
- District map
- Older district map (1992 to 2000)
US House, California District 5, 1994, every candidate Candidate Party Votes and share Share DemocraticRobert T MatsuiWon Democratic 125,04268.5% RepublicanRobert S Dinsmore Republican 52,90529.0% OtherGordon Mors Other 4,6492.5% - Votes for listed candidates
- 230,560
- Election day
- November 3, 1992
- District map
- Older district map (1992 to 2000)
US House, California District 5, 1992, every candidate Candidate Party Votes and share Share DemocraticRobert T MatsuiWon Democratic 158,25068.6% RepublicanRobert S Dinsmore Republican 58,69825.5% OtherGordon D Mors Other 4,7452.1% LibertarianChris Rufer Libertarian 4,5472.0% GreenTian Harter Green 4,3161.9% Scattered write-insName as filed: Writein Write-in 40.0% - Votes for listed candidates
- 156,304
- Election day
- November 6, 1990
- District map
- Older district map (1982 to 1990)
US House, California District 5, 1990, every candidate Candidate Party Votes and share Share DemocraticNancy PelosiWon Democratic 120,63377.2% RepublicanAlan Nichols Republican 35,67122.8% - Votes for listed candidates
- 174,758
- Election day
- November 8, 1988
- District map
- Older district map (1982 to 1990)
US House, California District 5, 1988, every candidate Candidate Party Votes and share Share DemocraticNancy PelosiWon Democratic 133,53076.4% RepublicanBruce Michael O'Neill Republican 33,69219.3% OtherTheodore "Ted" Zuur Other 3,9752.3% LibertarianSam Grove Libertarian 3,5612.0% - Votes for listed candidates
- 163,214
- Election day
- November 4, 1986
- District map
- Older district map (1982 to 1990)
US House, California District 5, 1986, every candidate Candidate Party Votes and share Share DemocraticSala BurtonWon Democratic 122,68875.2% RepublicanMike Garza Republican 36,03922.1% LibertarianSamuel K Grove Libertarian 2,4091.5% OtherTheodore "Ted" Zuur Other 2,0781.3% - Votes for listed candidates
- 193,204
- Election day
- November 6, 1984
- District map
- Older district map (1982 to 1990)
US House, California District 5, 1984, every candidate Candidate Party Votes and share Share DemocraticSala BurtonWon Democratic 139,69272.3% RepublicanTom Spinosa Republican 45,93023.8% LibertarianJoseph Fuhrig Libertarian 4,0082.1% OtherHenry Clark Other 3,5741.8% - Votes for listed candidates
- 178,311
- Election day
- November 2, 1982
- District map
- Older district map (1982 to 1990)
US House, California District 5, 1982, every candidate Candidate Party Votes and share Share DemocraticPhillip BurtonWon Democratic 103,26857.9% RepublicanMilton Marks Republican 72,13940.5% LibertarianJustin Raimondo Libertarian 2,9041.6% - Votes for listed candidates
- 197,821
- Election day
- November 4, 1980
- District map
- Older district map (1972 to 1980)
US House, California District 5, 1980, every candidate Candidate Party Votes and share Share DemocraticJohn L BurtonWon Democratic 101,10551.1% RepublicanDennis McQuaid Republican 89,62445.3% LibertarianDan P Dougherty Libertarian 7,0923.6% - Votes for listed candidates
- 158,649
- Election day
- November 7, 1978
- District map
- Older district map (1972 to 1980)
US House, California District 5, 1978, every candidate Candidate Party Votes and share Share DemocraticJohn L BurtonWon Democratic 106,04666.8% RepublicanDolores Skore Republican 52,60333.2% - Votes for listed candidates
- 167,754
- Election day
- November 2, 1976
- District map
- Older district map (1972 to 1980)
US House, California District 5, 1976, every candidate Candidate Party Votes and share Share DemocraticJohn L BurtonWon Democratic 103,74661.8% RepublicanBranwell Fanning Republican 64,00838.2%
1976 to 2024: MIT Election Data and Science Lab, U.S. House 1976-2024, retrieved Oct 28, 2026. Compiled by MIT Election Data and Science Lab (MEDSL) from official returns; not an official source
California District 5 was redrawn for 2026, so every row here ran on older lines and covers different territory. The map in force, by state
Download and cite
Cite this page
Election Wrld. (2026). California District 5, US House results. https://www.electionwrld.com/ca/congress/5. Retrieved October 30, 2026.
Embed this seat
<iframe src="https://www.electionwrld.com/embed/ca/congress/5" title="California District 5, US House" width="100%" height="400" style="border:0;max-width:640px" loading="lazy"></iframe>
<p style="font-size:13px">Data: <a href="https://www.electionwrld.com">Election Wrld</a>, CC BY 4.0</p>Sources
Sources: MIT Election Data and Science Lab, U.S. House 1976-2024 (CC0 1.0), retrieved Oct 28, 2026, compiled by MIT Election Data and Science Lab (MEDSL) from official returns, not an official source; Census TIGERweb Legislative MapServer (120th CDs layer 0, 119th CDs layer 4, 2026 SLD upper layer 1 and lower layer 2) (US Census Bureau, public domain), retrieved Oct 28, 2026; unitedstates/congress-legislators (current) (CC0-1.0), retrieved Oct 28, 2026, compiled by the @unitedstates project volunteers (rosters from official congressional sources) from official returns, not an official source.
DataState data (JSON)Sources: MIT Election Data and Science Lab, U.S. House 1976-2024, FEC, DIME (ODC-BY), Portraits: unitedstates/images (public domain)Data as of Oct 28, 2026