

New York District 7
Tue, Nov 3 · Seat held by Nydia M. Velázquez Democratic since Jan 1993 (not a candidate in 2026)
No published poll names both candidates.Last result · 2024 general (different candidates): Nydia M. Velázquez (D) 77.9, Bill Kregler (R) 21.8
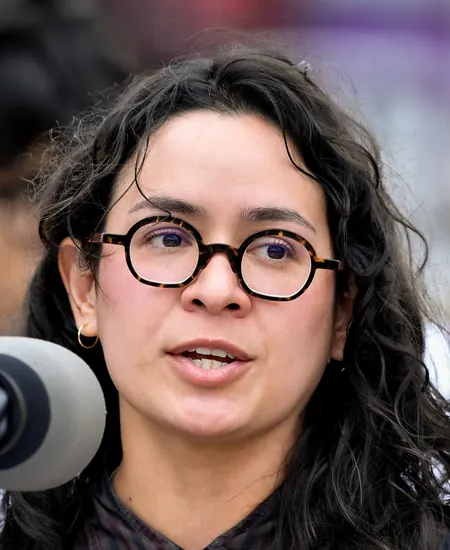
Show all 3 candidates on the ballot
- Claire ValdezDemocratic(Democratic, Working Families)
- Melvin RiveraRepublican(Republican, Conservative)
- Priscilla GhaznaviOther(Our Future)
Showing major-party nominees, incumbents and candidates with 5%+ in the latest poll or comparable fundraising.
- Last election
- Nydia M. Velázquez (Democratic) won by 56.1 points, 2024
- Since 2022
- District lines changed, so no comparison
- On the 2026 ballot
- 3 candidates, open seat
Side by side
Left column: RiveraRight column: Valdez
- Total receipts, 2025-2026 cycle, through Oct 14
- No FEC report
- $1.9M
- Cash on hand
- No FEC report
- $110K
- Races
- None listed
- Won 1 of 1
- Years since first win
- Not available
- 2
- Age on Election Day
- Not available
- 37
Money: FEC bulk data, through Oct 14. One or more are matched to the FEC by name, party and seat, so a total could belong to someone else.
How these are counted
Total receipts line of each candidate’s principal campaign committee, 2025-2026 cycle. Other sites may show career, six-year or all-committee totals, which differ. Valdez: $1,915,867 received, $110,430 cash on hand. Wins and losses count the races in our results files, the same as each profile.
More about this race
Candidates on the ballot
Open seat
The current holder, Nydia M. Velázquez, is not on the candidate list.
- Claire ValdezDemocratic(Democratic, Working Families)
- Melvin RiveraRepublican(Republican, Conservative)
- Priscilla GhaznaviOther(Our Future)
Source: elections.ny.gov, dated Oct 7
Shift since 2022: lines changed, no comparison.
All New York districts
- D 15+ pts
- D 5 to 15 pts
- D under 5 pts
- R under 5 pts
- R 5 to 15 pts
- R 15+ pts
- Other winner
- No data
Show these districts as a list (26)
- New York District 1· Nick LaLota (R), Republican by 10.4 points, 2024
- New York District 2· Andrew R. Garbarino (R), Republican by 19.5 points, 2024
- New York District 3· Thomas R. Suozzi (D), Democratic by 3.6 points, 2024
- New York District 4· Laura Gillen (D), Democratic by 2.3 points, 2024
- New York District 5· Gregory W. Meeks (D), Democratic by 45.7 points, 2024
- New York District 6· Grace Meng (D), Democratic by 23.0 points, 2024
- New York District 7· Nydia M. Velázquez (D), Democratic by 56.1 points, 2024
- New York District 8· Hakeem S. Jeffries (D), Democratic by 50.6 points, 2024
- New York District 9· Yvette D. Clarke (D), Democratic by 48.0 points, 2024
- New York District 10· Daniel S. Goldman (D), Democratic by 66.2 points, 2024
- New York District 11· Nicole Malliotakis (R), Republican by 28.0 points, 2024
- New York District 12· Jerrold Nadler (D), Democratic by 60.9 points, 2024
- New York District 13· Adriano Espaillat (D), Democratic by 66.6 points, 2024
- New York District 14· Alexandria Ocasio-Cortez (D), Democratic by 38.2 points, 2024
- New York District 15· Ritchie Torres (D), Democratic by 55.2 points, 2024
- New York District 16· George Latimer (D), Democratic by 43.0 points, 2024
- New York District 17· Michael Lawler (R), Republican by 6.3 points, 2024
- New York District 18· Patrick Ryan (D), Democratic by 14.3 points, 2024
- New York District 19· Josh Riley (D), Democratic by 2.3 points, 2024
- New York District 20· Paul Tonko (D), Democratic by 22.3 points, 2024
- New York District 21· Elise M. Stefanik (R), Republican by 24.0 points, 2024
- New York District 22· John W. Mannion (D), Democratic by 9.1 points, 2024
- New York District 23· Nicholas A. Langworthy (R), Republican by 31.6 points, 2024
- New York District 24· Claudia Tenney (R), Republican by 31.3 points, 2024
- New York District 25· Joseph D. Morelle (D), Democratic by 21.6 points, 2024
- New York District 26· Timothy M. Kennedy (D), Democratic by 30.3 points, 2024
Map settings
Vote in New York
Trouble voting? Election Protection hotline: 866-OUR-VOTE. A nonpartisan coalition of civil-rights and voting-rights groups, not a government service. 866ourvote.org
History (25 elections for this seat)
- Votes for listed candidates
- 221,779
- Election day
- November 5, 2024
- District map
- Same as today
US House, New York District 7, 2024, every candidate Candidate Party Votes and share Share DemocraticNydia M. VelázquezWon Democratic 172,79577.9% RepublicanBill Kregler Republican 48,43521.8% Scattered write-insName as filed: Scattering Write-in 5490.2% - Votes for listed candidates
- 148,304
- Election day
- November 8, 2022
- District map
- Same as today
US House, New York District 7, 2022, every candidate Candidate Party Votes and share Share DemocraticNydia M. VelázquezWon Democratic 119,47380.6% RepublicanJuan Pagan Republican 28,59719.3% Scattered write-insName as filed: Scattering Write-in 2340.2% - Votes for listed candidates
- 225,453
- Election day
- November 3, 2020
- District map
- Older district map (2012 to 2020)
US House, New York District 7, 2020, every candidate Candidate Party Votes and share Share DemocraticNydia M. VelázquezWon Democratic 191,07384.8% RepublicanBrian W Kelly Republican 32,52014.4% LibertarianGilbert Midonnet Libertarian 1,5220.7% Scattered write-insName as filed: Writein Write-in 3380.1% - Votes for listed candidates
- 157,302
- Election day
- November 6, 2018
- District map
- Older district map (2012 to 2020)
US House, New York District 7, 2018, every candidate Candidate Party Votes and share Share DemocraticNydia M. VelázquezWon Democratic 146,68793.3% OtherJoseph Lieberman Other 8,6705.5% OtherJeffrey M Kurzon Other 1,7401.1% Scattered write-insName as filed: Writein Write-in 2050.1% - Votes for listed candidates
- 189,890
- Election day
- November 8, 2016
- District map
- Older district map (2012 to 2020)
US House, New York District 7, 2016, every candidate Candidate Party Votes and share Share DemocraticNydia M. VelázquezWon Democratic 172,14690.7% RepublicanAllan E Romaguera Republican 17,4789.2% Scattered write-insName as filed: Writein Write-in 2660.1% - Votes for listed candidates
- 63,704
- Election day
- November 4, 2014
- District map
- Older district map (2012 to 2020)
US House, New York District 7, 2014, every candidate Candidate Party Votes and share Share DemocraticNydia M. VelázquezWon Democratic 56,59388.8% RepublicanJose Luis Fernandez Republican 5,7139.0% OtherAllan E Romaguera Other 1,3982.2% - Votes for listed candidates
- 149,133
- Election day
- November 6, 2012
- District map
- Older district map (2012 to 2020)
US House, New York District 7, 2012, every candidate Candidate Party Votes and share Share DemocraticNydia M. VelázquezWon Democratic 141,32294.8% OtherJames Murray Other 7,8115.2% - Votes for listed candidates
- 88,430
- Election day
- November 2, 2010
- District map
- Older district map (2002 to 2010)
US House, New York District 7, 2010, every candidate Candidate Party Votes and share Share DemocraticJoseph CrowleyWon Democratic 71,24780.6% RepublicanKenneth A Reynolds Republican 16,14518.3% GreenAnthony Gronowicz Green 1,0381.2% - Votes for listed candidates
- 139,936
- Election day
- November 4, 2008
- District map
- Older district map (2002 to 2010)
US House, New York District 7, 2008, every candidate Candidate Party Votes and share Share DemocraticJoseph CrowleyWon Democratic 118,45984.7% RepublicanWilliam E Britt Jr Republican 21,47715.3% - Votes for listed candidates
- 76,217
- Election day
- November 7, 2006
- District map
- Older district map (2002 to 2010)
US House, New York District 7, 2006, every candidate Candidate Party Votes and share Share DemocraticJoseph CrowleyWon Democratic 63,99784.0% RepublicanKevin Brawley Republican 12,22016.0% - Votes for listed candidates
- 128,823
- Election day
- November 2, 2004
- District map
- Older district map (2002 to 2010)
US House, New York District 7, 2004, every candidate Candidate Party Votes and share Share DemocraticJoseph CrowleyWon Democratic 104,27580.9% RepublicanJoseph Cinquemain Republican 24,54819.1% - Votes for listed candidates
- 69,539
- Election day
- November 5, 2002
- District map
- Older district map (2002 to 2010)
US House, New York District 7, 2002, every candidate Candidate Party Votes and share Share DemocraticJoseph CrowleyWon Democratic 50,96773.3% RepublicanKevin Brawley Republican 18,57226.7% - Votes for listed candidates
- 109,101
- Election day
- November 7, 2000
- District map
- Older district map (1992 to 2000)
US House, New York District 7, 2000, every candidate Candidate Party Votes and share Share DemocraticJoseph CrowleyWon Democratic 78,20771.7% RepublicanRose Robies Birtley Republican 24,59222.5% OtherRobert E Hurley Other 3,1312.9% GreenPaul Gilman Green 1,9991.8% OtherGarafalia Christea Other 1,1721.1% - Votes for listed candidates
- 73,780
- Election day
- November 3, 1998
- District map
- Older district map (1992 to 2000)
US House, New York District 7, 1998, every candidate Candidate Party Votes and share Share DemocraticJoseph CrowleyWon Democratic 50,92469.0% RepublicanJames J Dillon Republican 18,89625.6% OtherRichard Retcho Other 3,9605.4% - Votes for listed candidates
- 110,940
- Election day
- November 5, 1996
- District map
- Older district map (1992 to 2000)
US House, New York District 7, 1996, every candidate Candidate Party Votes and share Share DemocraticThomas J MantonWon Democratic 78,84871.1% RepublicanRose Birtley Republican 32,09228.9% - Votes for listed candidates
- 123,885
- Election day
- November 8, 1994
- District map
- Older district map (1992 to 2000)
US House, New York District 7, 1994, every candidate Candidate Party Votes and share Share DemocraticThomas J MantonWon Democratic 58,93547.6% Scattered write-insName as filed: Writein Write-in 56,25245.4% OtherRobert E Hurley Other 8,6987.0% - Votes for listed candidates
- 126,919
- Election day
- November 3, 1992
- District map
- Older district map (1992 to 2000)
US House, New York District 7, 1992, every candidate Candidate Party Votes and share Share DemocraticThomas J MantonWon Democratic 72,28056.9% RepublicanDennis C Shea Republican 54,63943.1% - Votes for listed candidates
- 83,438
- Election day
- November 6, 1990
- District map
- Older district map (1982 to 1990)
US House, New York District 7, 1990, every candidate Candidate Party Votes and share Share DemocraticGary L AckermanWon Democratic 51,09161.2% Scattered write-insName as filed: Writein Write-in 32,34738.8% - Votes for listed candidates
- 93,120
- Election day
- November 8, 1988
- District map
- Older district map (1982 to 1990)
US House, New York District 7, 1988, every candidate Candidate Party Votes and share Share DemocraticGary L AckermanWon Democratic 93,120100.0% - Votes for listed candidates
- 81,220
- Election day
- November 4, 1986
- District map
- Older district map (1982 to 1990)
US House, New York District 7, 1986, every candidate Candidate Party Votes and share Share DemocraticGary L AckermanWon Democratic 62,83677.4% RepublicanEdward Nelson Rodriguez Republican 18,38422.6% - Votes for listed candidates
- 141,044
- Election day
- November 6, 1984
- District map
- Older district map (1982 to 1990)
US House, New York District 7, 1984, every candidate Candidate Party Votes and share Share DemocraticGary L AckermanWon Democratic 97,67469.3% RepublicanGustave A Reifenkugel Republican 43,37030.7% - Votes for listed candidates
- 108,845
- Election day
- November 2, 1982
- District map
- Older district map (1982 to 1990)
US House, New York District 7, 1982, every candidate Candidate Party Votes and share Share DemocraticBenjamin S RosenthalWon Democratic 84,01377.2% RepublicanAlbert Lemishow Republican 24,83222.8% - Votes for listed candidates
- 100,840
- Election day
- November 4, 1980
- District map
- Older district map (1972 to 1980)
US House, New York District 7, 1980, every candidate Candidate Party Votes and share Share DemocraticJoseph P AddabboWon Democratic 96,13795.3% OtherFrancis A Lees Other 4,7034.7% - Votes for listed candidates
- 77,001
- Election day
- November 7, 1978
- District map
- Older district map (1972 to 1980)
US House, New York District 7, 1978, every candidate Candidate Party Votes and share Share DemocraticJoseph P AddabboWon Democratic 73,06694.9% OtherMark Elliot Scott Other 3,9355.1% - Votes for listed candidates
- 113,373
- Election day
- November 2, 1976
- District map
- Older district map (1972 to 1980)
US House, New York District 7, 1976, every candidate Candidate Party Votes and share Share DemocraticJoseph P AddabboWon Democratic 107,31294.7% OtherWilliam H Whitman Other 5,3214.7% OtherKeith Jones Other 7400.7%
1976 to 2024: MIT Election Data and Science Lab, U.S. House 1976-2024, retrieved Oct 28, 2026. Compiled by MIT Election Data and Science Lab (MEDSL) from official returns; not an official source
District numbers are reused after each redistricting, so rows on older lines cover different territory than today's New York District 7.
Download and cite
Cite this page
Election Wrld. (2026). New York District 7, US House results. https://www.electionwrld.com/ny/congress/7. Retrieved October 30, 2026.
Embed this seat
<iframe src="https://www.electionwrld.com/embed/ny/congress/7" title="New York District 7, US House" width="100%" height="400" style="border:0;max-width:640px" loading="lazy"></iframe>
<p style="font-size:13px">Data: <a href="https://www.electionwrld.com">Election Wrld</a>, CC BY 4.0</p>Sources
Sources: MIT Election Data and Science Lab, U.S. House 1976-2024 (CC0 1.0), retrieved Oct 28, 2026, compiled by MIT Election Data and Science Lab (MEDSL) from official returns, not an official source; Census TIGERweb Legislative MapServer (120th CDs layer 0, 119th CDs layer 4, 2026 SLD upper layer 1 and lower layer 2) (US Census Bureau, public domain), retrieved Oct 28, 2026; unitedstates/congress-legislators (current) (CC0-1.0), retrieved Oct 28, 2026, compiled by the @unitedstates project volunteers (rosters from official congressional sources) from official returns, not an official source.
DataState data (JSON)Sources: MIT Election Data and Science Lab, U.S. House 1976-2024, FEC, Photo creditsData as of Oct 28, 2026