

New York District 9
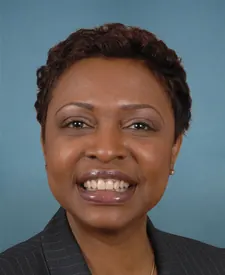
Tue, Nov 3 · Seat held by Yvette D. Clarke Democratic since Jan 2007
No published poll names both candidates.Last result · 2024 general: Yvette D. Clarke (D) 73.5, Menachem M. Raitport (R) 25.5
- Last election
- Yvette D. Clarke (Democratic) won by 48.0 points, 2024
- Since 2022
- District lines changed, so no comparison
- On the 2026 ballot
- 2 candidates
Side by side
Left column: AzumahRight column: Clarke
- Total receipts, 2025-2026 cycle, through Oct 14
- No FEC report
- $1.3M
- Cash on hand
- No FEC report
- $66K
- Donor-based spectrum
- LiberalCentristConservativeClarkeNo published score for Azumah
- Races
- None listed
- Won 10 of 11
- Years since first win
- Not available
- 19
- Age on Election Day
- Not available
- 61
Money: FEC bulk data, through Oct 14. One or more are matched to the FEC by name, party and seat, so a total could belong to someone else.
How these are counted
Total receipts line of each candidate’s principal campaign committee, 2025-2026 cycle. Other sites may show career, six-year or all-committee totals, which differ. Clarke: $1,288,234 received, $66,299 cash on hand. The spectrum is a published research score, not our rating. How this works. Wins and losses count the races in our results files, the same as each profile.
More about this race
Candidates on the ballot
- Yvette D. ClarkeIncumbentDemocratic
- Joel AzumahRepublican(Republican, Conservative)
Source: elections.ny.gov, dated Oct 7
Shift since 2022: lines changed, no comparison.
All New York districts
- D 15+ pts
- D 5 to 15 pts
- D under 5 pts
- R under 5 pts
- R 5 to 15 pts
- R 15+ pts
- Other winner
- No data
Show these districts as a list (26)
- New York District 1· Nick LaLota (R), Republican by 10.4 points, 2024
- New York District 2· Andrew R. Garbarino (R), Republican by 19.5 points, 2024
- New York District 3· Thomas R. Suozzi (D), Democratic by 3.6 points, 2024
- New York District 4· Laura Gillen (D), Democratic by 2.3 points, 2024
- New York District 5· Gregory W. Meeks (D), Democratic by 45.7 points, 2024
- New York District 6· Grace Meng (D), Democratic by 23.0 points, 2024
- New York District 7· Nydia M. Velázquez (D), Democratic by 56.1 points, 2024
- New York District 8· Hakeem S. Jeffries (D), Democratic by 50.6 points, 2024
- New York District 9· Yvette D. Clarke (D), Democratic by 48.0 points, 2024
- New York District 10· Daniel S. Goldman (D), Democratic by 66.2 points, 2024
- New York District 11· Nicole Malliotakis (R), Republican by 28.0 points, 2024
- New York District 12· Jerrold Nadler (D), Democratic by 60.9 points, 2024
- New York District 13· Adriano Espaillat (D), Democratic by 66.6 points, 2024
- New York District 14· Alexandria Ocasio-Cortez (D), Democratic by 38.2 points, 2024
- New York District 15· Ritchie Torres (D), Democratic by 55.2 points, 2024
- New York District 16· George Latimer (D), Democratic by 43.0 points, 2024
- New York District 17· Michael Lawler (R), Republican by 6.3 points, 2024
- New York District 18· Patrick Ryan (D), Democratic by 14.3 points, 2024
- New York District 19· Josh Riley (D), Democratic by 2.3 points, 2024
- New York District 20· Paul Tonko (D), Democratic by 22.3 points, 2024
- New York District 21· Elise M. Stefanik (R), Republican by 24.0 points, 2024
- New York District 22· John W. Mannion (D), Democratic by 9.1 points, 2024
- New York District 23· Nicholas A. Langworthy (R), Republican by 31.6 points, 2024
- New York District 24· Claudia Tenney (R), Republican by 31.3 points, 2024
- New York District 25· Joseph D. Morelle (D), Democratic by 21.6 points, 2024
- New York District 26· Timothy M. Kennedy (D), Democratic by 30.3 points, 2024
Map settings
Vote in New York
Trouble voting? Election Protection hotline: 866-OUR-VOTE. A nonpartisan coalition of civil-rights and voting-rights groups, not a government service. 866ourvote.org
History (25 elections for this seat)
- Votes for listed candidates
- 235,772
- Election day
- November 5, 2024
- District map
- Same as today
US House, New York District 9, 2024, every candidate Candidate Party Votes and share Share DemocraticYvette D. ClarkeWon Democratic 173,20773.5% RepublicanMenachem M. Raitport Republican 60,06425.5% Scattered write-insName as filed: Scattering Write-in 2,5011.1% - Votes for listed candidates
- 143,853
- Election day
- November 8, 2022
- District map
- Same as today
US House, New York District 9, 2022, every candidate Candidate Party Votes and share Share DemocraticYvette D. ClarkeWon Democratic 116,97081.3% OtherMenachem M. Raitport Other 26,52118.4% Scattered write-insName as filed: Scattering Write-in 3620.3% - Votes for listed candidates
- 277,248
- Election day
- November 3, 2020
- District map
- Older district map (2012 to 2020)
US House, New York District 9, 2020, every candidate Candidate Party Votes and share Share DemocraticYvette D. ClarkeWon Democratic 230,22183.0% RepublicanConstantine Jean-Pierre Republican 43,95015.9% LibertarianGary Popkin Libertarian 1,6440.6% OtherJoel B Anabilah-Azumah Other 1,0520.4% Scattered write-insName as filed: Writein Write-in 3810.1% - Votes for listed candidates
- 203,423
- Election day
- November 6, 2018
- District map
- Older district map (2012 to 2020)
US House, New York District 9, 2018, every candidate Candidate Party Votes and share Share DemocraticYvette D. ClarkeWon Democratic 181,45589.2% RepublicanLutchi Gayot Republican 20,90110.3% OtherJoel Anabilah-Azumah Other 7790.4% Scattered write-insName as filed: Writein Write-in 2880.1% - Votes for listed candidates
- 232,094
- Election day
- November 8, 2016
- District map
- Older district map (2012 to 2020)
US House, New York District 9, 2016, every candidate Candidate Party Votes and share Share DemocraticYvette D. ClarkeWon Democratic 214,18992.3% OtherAlan Bellone Other 17,5767.6% Scattered write-insName as filed: Writein Write-in 3290.1% - Votes for listed candidates
- 92,386
- Election day
- November 4, 2014
- District map
- Older district map (2012 to 2020)
US House, New York District 9, 2014, every candidate Candidate Party Votes and share Share DemocraticYvette D. ClarkeWon Democratic 82,65989.5% OtherDaniel J Cavanagh Other 9,72710.5% - Votes for listed candidates
- 213,296
- Election day
- November 6, 2012
- District map
- Older district map (2012 to 2020)
US House, New York District 9, 2012, every candidate Candidate Party Votes and share Share DemocraticYvette D. ClarkeWon Democratic 186,14187.3% RepublicanDaniel J Cavanagh Republican 24,16411.3% GreenVivia M Morgan Green 2,9911.4% - Votes for listed candidates
- 110,140
- Election day
- November 2, 2010
- District map
- Older district map (2002 to 2010)
US House, New York District 9, 2010, every candidate Candidate Party Votes and share Share DemocraticAnthony D WeinerWon Democratic 67,01160.8% RepublicanRobert L Turner Republican 43,12939.2% - Votes for listed candidates
- 120,583
- Election day
- November 4, 2008
- District map
- Older district map (2002 to 2010)
US House, New York District 9, 2008, every candidate Candidate Party Votes and share Share DemocraticAnthony D WeinerWon Democratic 112,20593.1% OtherAlfred F Donohue Other 8,3786.9% - Votes for listed candidates
- 71,762
- Election day
- November 7, 2006
- District map
- Older district map (2002 to 2010)
US House, New York District 9, 2006, every candidate Candidate Party Votes and share Share DemocraticAnthony D WeinerWon Democratic 71,762100.0% - Votes for listed candidates
- 158,476
- Election day
- November 2, 2004
- District map
- Older district map (2002 to 2010)
US House, New York District 9, 2004, every candidate Candidate Party Votes and share Share DemocraticAnthony D WeinerWon Democratic 113,02571.3% RepublicanGerard J Cronin Republican 45,45128.7% - Votes for listed candidates
- 92,435
- Election day
- November 5, 2002
- District map
- Older district map (2002 to 2010)
US House, New York District 9, 2002, every candidate Candidate Party Votes and share Share DemocraticAnthony D WeinerWon Democratic 60,73765.7% RepublicanAlfred F Donohue Republican 31,69834.3% - Votes for listed candidates
- 144,632
- Election day
- November 7, 2000
- District map
- Older district map (1992 to 2000)
US House, New York District 9, 2000, every candidate Candidate Party Votes and share Share DemocraticAnthony D WeinerWon Democratic 98,98368.4% RepublicanNoach Dear Republican 45,64931.6% - Votes for listed candidates
- 104,522
- Election day
- November 3, 1998
- District map
- Older district map (1992 to 2000)
US House, New York District 9, 1998, every candidate Candidate Party Votes and share Share DemocraticAnthony WeinerWon Democratic 69,43966.4% RepublicanLouis Telano Republican 24,48623.4% OtherMelinda Katz Other 5,6985.5% OtherArthur J Smith Other 4,8994.7% - Votes for listed candidates
- 143,213
- Election day
- November 5, 1996
- District map
- Older district map (1992 to 2000)
US House, New York District 9, 1996, every candidate Candidate Party Votes and share Share DemocraticCharles E SchumerWon Democratic 107,10774.8% RepublicanRobert J Verga Republican 30,48821.3% OtherMichael Mossa Other 5,6183.9% - Votes for listed candidates
- 158,807
- Election day
- November 8, 1994
- District map
- Older district map (1992 to 2000)
US House, New York District 9, 1994, every candidate Candidate Party Votes and share Share DemocraticCharles E SchumerWon Democratic 95,13959.9% RepublicanJames P McCall Republican 35,88022.6% Scattered write-insName as filed: Writein Write-in 27,78817.5% - Votes for listed candidates
- 131,530
- Election day
- November 3, 1992
- District map
- Older district map (1992 to 2000)
US House, New York District 9, 1992, every candidate Candidate Party Votes and share Share DemocraticCharles E SchumerWon Democratic 116,54588.6% OtherAlice G Gaffney Other 14,98511.4% - Votes for listed candidates
- 74,625
- Election day
- November 6, 1990
- District map
- Older district map (1982 to 1990)
US House, New York District 9, 1990, every candidate Candidate Party Votes and share Share DemocraticThomas J MantonWon Democratic 35,17747.1% Scattered write-insName as filed: Writein Write-in 19,98126.8% RepublicanAnn Pfoser Darby Republican 13,33017.9% OtherThomas V Ognibene Other 6,1378.2% - Votes for listed candidates
- 72,851
- Election day
- November 8, 1988
- District map
- Older district map (1982 to 1990)
US House, New York District 9, 1988, every candidate Candidate Party Votes and share Share DemocraticThomas MantonWon Democratic 72,851100.0% - Votes for listed candidates
- 73,126
- Election day
- November 4, 1986
- District map
- Older district map (1982 to 1990)
US House, New York District 9, 1986, every candidate Candidate Party Votes and share Share DemocraticThomas J MantonWon Democratic 50,73869.4% RepublicanSalvatore J Calise Republican 18,04024.7% OtherThomas V Ognibene Other 4,3485.9% - Votes for listed candidates
- 135,330
- Election day
- November 6, 1984
- District map
- Older district map (1982 to 1990)
US House, New York District 9, 1984, every candidate Candidate Party Votes and share Share DemocraticThomas J MantonWon Democratic 71,42052.8% RepublicanSerphin R Maltese Republican 63,91047.2% - Votes for listed candidates
- 102,820
- Election day
- November 2, 1982
- District map
- Older district map (1982 to 1990)
US House, New York District 9, 1982, every candidate Candidate Party Votes and share Share DemocraticGeraldine FerraroWon Democratic 75,28673.2% RepublicanJohn J Weigandt Republican 20,35219.8% OtherRalph G Groves Other 6,0115.8% OtherPatricia A Salargo Other 1,1711.1% - Votes for listed candidates
- 109,360
- Election day
- November 4, 1980
- District map
- Older district map (1972 to 1980)
US House, New York District 9, 1980, every candidate Candidate Party Votes and share Share DemocraticGeraldine FerraroWon Democratic 63,79658.3% RepublicanVito P Battista Republican 44,47340.7% OtherGertrude Geniale Other 1,0911.0% - Votes for listed candidates
- 94,787
- Election day
- November 7, 1978
- District map
- Older district map (1972 to 1980)
US House, New York District 9, 1978, every candidate Candidate Party Votes and share Share DemocraticGeraldine A FerraroWon Democratic 51,35054.2% RepublicanAlfred A Dellibovi Republican 42,10844.4% OtherTheodore E Garrison Other 1,3291.4% - Votes for listed candidates
- 115,195
- Election day
- November 2, 1976
- District map
- Older district map (1972 to 1980)
US House, New York District 9, 1976, every candidate Candidate Party Votes and share Share DemocraticJames J DelaneyWon Democratic 109,55295.1% OtherAlan M Kluger Other 5,6434.9%
1976 to 2024: MIT Election Data and Science Lab, U.S. House 1976-2024, retrieved Oct 28, 2026. Compiled by MIT Election Data and Science Lab (MEDSL) from official returns; not an official source
District numbers are reused after each redistricting, so rows on older lines cover different territory than today's New York District 9.
Download and cite
Cite this page
Election Wrld. (2026). New York District 9, US House results. https://www.electionwrld.com/ny/congress/9. Retrieved October 31, 2026.
Embed this seat
<iframe src="https://www.electionwrld.com/embed/ny/congress/9" title="New York District 9, US House" width="100%" height="400" style="border:0;max-width:640px" loading="lazy"></iframe>
<p style="font-size:13px">Data: <a href="https://www.electionwrld.com">Election Wrld</a>, CC BY 4.0</p>Sources
Sources: MIT Election Data and Science Lab, U.S. House 1976-2024 (CC0 1.0), retrieved Oct 28, 2026, compiled by MIT Election Data and Science Lab (MEDSL) from official returns, not an official source; Census TIGERweb Legislative MapServer (120th CDs layer 0, 119th CDs layer 4, 2026 SLD upper layer 1 and lower layer 2) (US Census Bureau, public domain), retrieved Oct 28, 2026; unitedstates/congress-legislators (current) (CC0-1.0), retrieved Oct 28, 2026, compiled by the @unitedstates project volunteers (rosters from official congressional sources) from official returns, not an official source.
DataState data (JSON)Sources: MIT Election Data and Science Lab, U.S. House 1976-2024, FEC, DIME (ODC-BY), Portraits: unitedstates/images (public domain)Data as of Oct 28, 2026