

Pennsylvania District 1
Tue, Nov 3 · Seat held by Brian K. Fitzpatrick Republican since Jan 2017
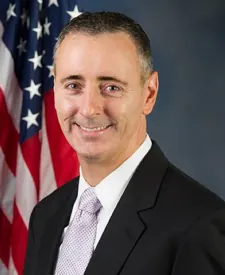
Fitzpatrick 49 · Harvie 48No polls in the last 7 weeksNewest poll · GQR, field dates Aug 19 to Aug 23, released Aug 31, 400 likely voters, partisan (D), per VoteHubPoll sponsored by House Majority PACPolls fetched Oct 30, 2:02 a.m. ET, from VoteHub
- Last election
- Brian K. Fitzpatrick (Republican) won by 12.8 points, 2024
- Margin since 2022
- 3.0 points toward Republicans
- On the 2026 ballot
- 2 candidates
Polls over time
One published poll names these candidates: GQR, Aug 19 to Aug 23, released Aug 31. All 1 on the polls page. Polls fetched Oct 30, 2:02 a.m. ET, from VoteHub.
Side by side
Left column: FitzpatrickRight column: Harvie
- Total receipts, 2025-2026 cycle, through Oct 14
- $8.0M
- $3.2M
- Cash on hand
- $709K
- $409K
- Donor-based spectrum
- LiberalCentristConservativeFitzpatrickNo published score for Harvie
- Races won and lost
- 5-0
- None on file
- Years since first win on file
- 9
- Not available
- Age on Election Day
- 52
- Not available
Money: FEC bulk data, through Oct 14. One or more are matched to the FEC by name, party and seat, so a total could belong to someone else.
How these are counted
Total receipts line of each candidate’s principal campaign committee, 2025-2026 cycle. Other sites may show career, six-year or all-committee totals, which differ. Fitzpatrick: $8,021,376 received, $709,097 cash on hand. Harvie: $3,167,942 received, $409,413 cash on hand. The spectrum is a published research score, not our rating. How this works. Wins and losses count the races in our results files, the same as each profile.
More about this race
Candidates on the ballot
- Robert J Harvie JrDemocratic
- Brian K. FitzpatrickIncumbentRepublican
Source: pavoterservices.pa.gov, dated Oct 28
Shift since 2022: 3.0 points toward Republicans (Republican by 9.8 in 2022, Republican by 12.8 in 2024).
All Pennsylvania districts
- D 15+ pts
- D 5 to 15 pts
- D under 5 pts
- R under 5 pts
- R 5 to 15 pts
- R 15+ pts
- Other winner
- No data
Show these districts as a list (17)
- Pennsylvania District 1· Brian K. Fitzpatrick (R), Republican by 12.8 points, 2024
- Pennsylvania District 2· Brendan F. Boyle (D), Democratic by 43.0 points, 2024
- Pennsylvania District 3· Dwight Evans (D), unopposed, 2024
- Pennsylvania District 4· Madeleine Dean (D), Democratic by 18.2 points, 2024
- Pennsylvania District 5· Mary Gay Scanlon (D), Democratic by 30.6 points, 2024
- Pennsylvania District 6· Chrissy Houlahan (D), Democratic by 12.4 points, 2024
- Pennsylvania District 7· Ryan Mackenzie (R), Republican by 1.0 point, 2024
- Pennsylvania District 8· Robert P. Bresnahan, Jr. (R), Republican by 1.6 points, 2024
- Pennsylvania District 9· Daniel Meuser (R), Republican by 41.0 points, 2024
- Pennsylvania District 10· Scott Perry (R), Republican by 1.2 points, 2024
- Pennsylvania District 11· Lloyd Smucker (R), Republican by 25.8 points, 2024
- Pennsylvania District 12· Summer L. Lee (D), Democratic by 12.8 points, 2024
- Pennsylvania District 13· John Joyce (R), Republican by 48.4 points, 2024
- Pennsylvania District 14· Guy Reschenthaler (R), Republican by 33.2 points, 2024
- Pennsylvania District 15· Glenn Thompson (R), Republican by 43.0 points, 2024
- Pennsylvania District 16· Mike Kelly (R), Republican by 27.4 points, 2024
- Pennsylvania District 17· Christopher R. Deluzio (D), Democratic by 7.8 points, 2024
Map settings
Vote in Pennsylvania
Trouble voting? Election Protection hotline: 866-OUR-VOTE. A nonpartisan coalition of civil-rights and voting-rights groups, not a government service. 866ourvote.org
Official results for Pennsylvania
History (25 elections for this seat)
- Votes for listed candidates
- 463,432
- Election day
- November 5, 2024
- District map
- Same as today
US House, Pennsylvania District 1, 2024, every candidate Candidate Party Votes and share Share RepublicanBrian K. FitzpatrickWon Republican 261,39056.4% DemocraticAshley Ehasz Democratic 202,04243.6% - Votes for listed candidates
- 367,380
- Election day
- November 8, 2022
- District map
- Same as today
US House, Pennsylvania District 1, 2022, every candidate Candidate Party Votes and share Share RepublicanBrian K. FitzpatrickWon Republican 201,57154.9% DemocraticAshley Ehasz Democratic 165,80945.1% - Votes for listed candidates
- 441,679
- Election day
- November 3, 2020
- District map
- Older district map (2012 to 2020)
US House, Pennsylvania District 1, 2020, every candidate Candidate Party Votes and share Share RepublicanBrian K. FitzpatrickWon Republican 249,80456.6% DemocraticChristina Finello Democratic 191,87543.4% - Votes for listed candidates
- 329,798
- Election day
- November 6, 2018
- District map
- Older district map (2012 to 2020)
US House, Pennsylvania District 1, 2018, every candidate Candidate Party Votes and share Share RepublicanBrian K. FitzpatrickWon Republican 169,05351.3% DemocraticHenry Scott Wallace Democratic 160,74548.7% - Votes for listed candidates
- 299,010
- Election day
- November 8, 2016
- District map
- Older district map (2012 to 2020)
US House, Pennsylvania District 1, 2016, every candidate Candidate Party Votes and share Share DemocraticRobert A BradyWon Democratic 245,79182.2% RepublicanDeborah Williams Republican 53,21917.8% - Votes for listed candidates
- 158,441
- Election day
- November 4, 2014
- District map
- Older district map (2012 to 2020)
US House, Pennsylvania District 1, 2014, every candidate Candidate Party Votes and share Share DemocraticRobert A BradyWon Democratic 131,24882.8% RepublicanMegan Rath Republican 27,19317.2% - Votes for listed candidates
- 277,102
- Election day
- November 6, 2012
- District map
- Older district map (2012 to 2020)
US House, Pennsylvania District 1, 2012, every candidate Candidate Party Votes and share Share DemocraticRobert A BradyWon Democratic 235,39484.9% RepublicanJohn Featherman Republican 41,70815.1% - Votes for listed candidates
- 149,944
- Election day
- November 2, 2010
- District map
- Older district map (2002 to 2010)
US House, Pennsylvania District 1, 2010, every candidate Candidate Party Votes and share Share DemocraticRobert A BradyWon Democratic 149,944100.0% - Votes for listed candidates
- 267,513
- Election day
- November 4, 2008
- District map
- Older district map (2002 to 2010)
US House, Pennsylvania District 1, 2008, every candidate Candidate Party Votes and share Share DemocraticRobert A BradyWon Democratic 242,79990.8% RepublicanMike Muhammad Republican 24,7149.2% - Votes for listed candidates
- 137,999
- Election day
- November 7, 2006
- District map
- Older district map (2002 to 2010)
US House, Pennsylvania District 1, 2006, every candidate Candidate Party Votes and share Share DemocraticRobert A BradyWon Democratic 137,987100.0% Scattered write-insName as filed: Writein Write-in 120.0% - Votes for listed candidates
- 248,585
- Election day
- November 2, 2004
- District map
- Older district map (2002 to 2010)
US House, Pennsylvania District 1, 2004, every candidate Candidate Party Votes and share Share DemocraticRobert A BradyWon Democratic 214,46286.3% RepublicanDeborah L Williams Republican 33,26613.4% OtherChristopher Randolph Other 8570.3% - Votes for listed candidates
- 140,090
- Election day
- November 5, 2002
- District map
- Older district map (2002 to 2010)
US House, Pennsylvania District 1, 2002, every candidate Candidate Party Votes and share Share DemocraticRobert A BradyWon Democratic 121,07686.4% RepublicanMarie G Delany Republican 17,44412.5% GreenMike Ewall Green 1,5701.1% - Votes for listed candidates
- 169,541
- Election day
- November 7, 2000
- District map
- Older district map (1992 to 2000)
US House, Pennsylvania District 1, 2000, every candidate Candidate Party Votes and share Share DemocraticRobert A BradyWon Democratic 149,62188.3% RepublicanSteven N Kush Republican 19,92011.7% - Votes for listed candidates
- 95,848
- Election day
- November 3, 1998
- District map
- Older district map (1992 to 2000)
US House, Pennsylvania District 1, 1998, every candidate Candidate Party Votes and share Share DemocraticRobert A BradyWon Democratic 77,78881.2% RepublicanWilliam M Harrison Republican 15,89816.6% LibertarianJohn Featherman Libertarian 1,1981.2% OtherNancy Cole Other 9641.0% - Votes for listed candidates
- 165,945
- Election day
- November 5, 1996
- District map
- Older district map (1992 to 2000)
US House, Pennsylvania District 1, 1996, every candidate Candidate Party Votes and share Share DemocraticThomas M FogliettaWon Democratic 145,21087.5% RepublicanJames D Cella Republican 20,73412.5% Scattered write-insName as filed: Writein Write-in 10.0% - Votes for listed candidates
- 122,264
- Election day
- November 8, 1994
- District map
- Older district map (1992 to 2000)
US House, Pennsylvania District 1, 1994, every candidate Candidate Party Votes and share Share DemocraticThomas M FogliettaWon Democratic 99,66981.5% RepublicanRoger F Gordon Republican 22,59518.5% - Votes for listed candidates
- 185,591
- Election day
- November 3, 1992
- District map
- Older district map (1992 to 2000)
US House, Pennsylvania District 1, 1992, every candidate Candidate Party Votes and share Share DemocraticThomas M FogliettaWon Democratic 150,17280.9% RepublicanCraig Snyder Republican 35,41919.1% - Votes for listed candidates
- 92,441
- Election day
- November 6, 1990
- District map
- Older district map (1982 to 1990)
US House, Pennsylvania District 1, 1990, every candidate Candidate Party Votes and share Share DemocraticThomas M FogliettaWon Democratic 73,42379.4% RepublicanJames Love Jackson Republican 19,01820.6% - Votes for listed candidates
- 167,825
- Election day
- November 8, 1988
- District map
- Older district map (1982 to 1990)
US House, Pennsylvania District 1, 1988, every candidate Candidate Party Votes and share Share DemocraticThomas M FogliettaWon Democratic 128,07676.3% RepublicanWilliam J O'Brien Republican 39,74923.7% - Votes for listed candidates
- 118,035
- Election day
- November 4, 1986
- District map
- Older district map (1982 to 1990)
US House, Pennsylvania District 1, 1986, every candidate Candidate Party Votes and share Share DemocraticThomas M FogliettaWon Democratic 88,22474.7% RepublicanAnthony J Mucciolo Republican 29,81125.3% - Votes for listed candidates
- 197,682
- Election day
- November 6, 1984
- District map
- Older district map (1982 to 1990)
US House, Pennsylvania District 1, 1984, every candidate Candidate Party Votes and share Share DemocraticThomas M FogliettaWon Democratic 148,12374.9% RepublicanCarmine Di Biase Republican 49,55925.1% - Votes for listed candidates
- 143,416
- Election day
- November 2, 1982
- District map
- Older district map (1982 to 1990)
US House, Pennsylvania District 1, 1982, every candidate Candidate Party Votes and share Share DemocraticThomas M FogliettaWon Democratic 103,62672.3% RepublicanMichael Marino Republican 38,15526.6% OtherLisa Brannan Other 1,0630.7% LibertarianRalph Mullinger Libertarian 5720.4% - Votes for listed candidates
- 155,451
- Election day
- November 4, 1980
- District map
- Older district map (1972 to 1980)
US House, Pennsylvania District 1, 1980, every candidate Candidate Party Votes and share Share OtherThomas M FogliettaWon Other 58,73737.8% DemocraticMichael Myers Democratic 52,95634.1% RepublicanRobert R Burke Republican 37,89324.4% LibertarianGeoffrey Steinberg Libertarian 3,1612.0% OtherShaheed Abdul Haqq Other 2,7041.7% - Votes for listed candidates
- 145,162
- Election day
- November 7, 1978
- District map
- Older district map (1972 to 1980)
US House, Pennsylvania District 1, 1978, every candidate Candidate Party Votes and share Share DemocraticMichael MyersWon Democratic 104,41271.9% RepublicanSamuel N Fanelli Republican 37,91326.1% LibertarianJeffrey C Smith Libertarian 2,8372.0% - Votes for listed candidates
- 159,205
- Election day
- November 2, 1976
- District map
- Older district map (1972 to 1980)
US House, Pennsylvania District 1, 1976, every candidate Candidate Party Votes and share Share DemocraticMichael O MyersWon Democratic 117,08773.5% RepublicanSamuel N Fanelli Republican 40,19125.2% OtherClare Fraenzl Other 1,3410.8% OtherHenry D Moss Other 5860.4%
1976 to 2024: MIT Election Data and Science Lab, U.S. House 1976-2024, retrieved Oct 28, 2026. Compiled by MIT Election Data and Science Lab (MEDSL) from official returns; not an official source
District numbers are reused after each redistricting, so rows on older lines cover different territory than today's Pennsylvania District 1.
Download and cite
Cite this page
Election Wrld. (2026). Pennsylvania District 1, US House results. https://www.electionwrld.com/pa/congress/1. Retrieved October 30, 2026.
Embed this seat
<iframe src="https://www.electionwrld.com/embed/pa/congress/1" title="Pennsylvania District 1, US House" width="100%" height="400" style="border:0;max-width:640px" loading="lazy"></iframe>
<p style="font-size:13px">Data: <a href="https://www.electionwrld.com">Election Wrld</a>, CC BY 4.0</p>Sources
Sources: MIT Election Data and Science Lab, U.S. House 1976-2024 (CC0 1.0), retrieved Oct 28, 2026, compiled by MIT Election Data and Science Lab (MEDSL) from official returns, not an official source; Census TIGERweb Legislative MapServer (120th CDs layer 0, 119th CDs layer 4, 2026 SLD upper layer 1 and lower layer 2) (US Census Bureau, public domain), retrieved Oct 28, 2026; unitedstates/congress-legislators (current) (CC0-1.0), retrieved Oct 28, 2026, compiled by the @unitedstates project volunteers (rosters from official congressional sources) from official returns, not an official source.
DataState data (JSON)Sources: MIT Election Data and Science Lab, U.S. House 1976-2024, VoteHub polls (CC BY 4.0), FEC, DIME (ODC-BY), Portraits: unitedstates/images (public domain)Data as of Oct 28, 2026