

Pennsylvania District 15
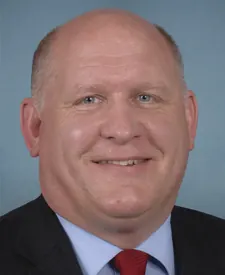
Tue, Nov 3 · Seat held by Glenn Thompson Republican since Jan 2009
No published poll names both candidates.Last result · 2024 general: Glenn Thompson (R) 71.5, Zach Womer (D) 28.5
- Last election
- Glenn Thompson (Republican) won by 43.0 points, 2024
- Margin since 2022
- 3.2 points toward Republicans
- On the 2026 ballot
- 2 candidates
Side by side
Left column: BilgerRight column: Thompson
- Total receipts, 2025-2026 cycle, through Oct 14
- $231K
- $2.2M
- Cash on hand
- $89K
- $704K
- Donor-based spectrum
- LiberalCentristConservativeThompsonNo published score for Bilger
- Races
- None listed
- Won 9 of 11
- Years since first win
- Not available
- 17
- Age on Election Day
- Not available
- 67
Money: FEC bulk data, through Oct 14. One or more are matched to the FEC by name, party and seat, so a total could belong to someone else.
How these are counted
Total receipts line of each candidate’s principal campaign committee, 2025-2026 cycle. Other sites may show career, six-year or all-committee totals, which differ. Bilger: $230,753 received, $88,914 cash on hand. Thompson: $2,152,944 received, $703,946 cash on hand. The spectrum is a published research score, not our rating. How this works. Wins and losses count the races in our results files, the same as each profile.
More about this race
Candidates on the ballot
- Ray BilgerDemocratic
- Glenn ThompsonIncumbentRepublican
Source: pavoterservices.pa.gov, dated Oct 28
Shift since 2022: 3.2 points toward Republicans (Republican by 39.8 in 2022, Republican by 43.0 in 2024).
All Pennsylvania districts
- D 15+ pts
- D 5 to 15 pts
- D under 5 pts
- R under 5 pts
- R 5 to 15 pts
- R 15+ pts
- Other winner
- No data
Show these districts as a list (17)
- Pennsylvania District 1· Brian K. Fitzpatrick (R), Republican by 12.8 points, 2024
- Pennsylvania District 2· Brendan F. Boyle (D), Democratic by 43.0 points, 2024
- Pennsylvania District 3· Dwight Evans (D), unopposed, 2024
- Pennsylvania District 4· Madeleine Dean (D), Democratic by 18.2 points, 2024
- Pennsylvania District 5· Mary Gay Scanlon (D), Democratic by 30.6 points, 2024
- Pennsylvania District 6· Chrissy Houlahan (D), Democratic by 12.4 points, 2024
- Pennsylvania District 7· Ryan Mackenzie (R), Republican by 1.0 point, 2024
- Pennsylvania District 8· Robert P. Bresnahan, Jr. (R), Republican by 1.6 points, 2024
- Pennsylvania District 9· Daniel Meuser (R), Republican by 41.0 points, 2024
- Pennsylvania District 10· Scott Perry (R), Republican by 1.2 points, 2024
- Pennsylvania District 11· Lloyd Smucker (R), Republican by 25.8 points, 2024
- Pennsylvania District 12· Summer L. Lee (D), Democratic by 12.8 points, 2024
- Pennsylvania District 13· John Joyce (R), Republican by 48.4 points, 2024
- Pennsylvania District 14· Guy Reschenthaler (R), Republican by 33.2 points, 2024
- Pennsylvania District 15· Glenn Thompson (R), Republican by 43.0 points, 2024
- Pennsylvania District 16· Mike Kelly (R), Republican by 27.4 points, 2024
- Pennsylvania District 17· Christopher R. Deluzio (D), Democratic by 7.8 points, 2024
Map settings
Vote in Pennsylvania
Trouble voting? Election Protection hotline: 866-OUR-VOTE. A nonpartisan coalition of civil-rights and voting-rights groups, not a government service. 866ourvote.org
Official results for Pennsylvania
History (25 elections for this seat)
- Votes for listed candidates
- 390,435
- Election day
- November 5, 2024
- District map
- Same as today
US House, Pennsylvania District 15, 2024, every candidate Candidate Party Votes and share Share RepublicanGlenn ThompsonWon Republican 279,02771.5% DemocraticZach Womer Democratic 111,40828.5% - Votes for listed candidates
- 305,146
- Election day
- November 8, 2022
- District map
- Same as today
US House, Pennsylvania District 15, 2022, every candidate Candidate Party Votes and share Share RepublicanGlenn ThompsonWon Republican 213,41769.9% DemocraticMike Molesevich Democratic 91,72930.1% - Votes for listed candidates
- 347,214
- Election day
- November 3, 2020
- District map
- Older district map (2012 to 2020)
US House, Pennsylvania District 15, 2020, every candidate Candidate Party Votes and share Share RepublicanGlenn ThompsonWonName as filed: Glenn W Thompson Jr Republican 255,05873.5% DemocraticRobert M Williams Democratic 92,15626.5% - Votes for listed candidates
- 243,572
- Election day
- November 6, 2018
- District map
- Older district map (2012 to 2020)
US House, Pennsylvania District 15, 2018, every candidate Candidate Party Votes and share Share RepublicanGlenn ThompsonWonName as filed: Glenn William Thompson Jr Republican 165,24567.8% DemocraticSusan Boser Democratic 78,32732.2% - Votes for listed candidates
- 326,474
- Election day
- November 8, 2016
- District map
- Older district map (2012 to 2020)
US House, Pennsylvania District 15, 2016, every candidate Candidate Party Votes and share Share RepublicanCharles W DentWon Republican 190,61858.4% DemocraticRick Daugherty Democratic 124,12938.0% LibertarianPaul Rizzo Libertarian 11,7273.6% - Votes for listed candidates
- 128,285
- Election day
- November 4, 2014
- District map
- Older district map (2012 to 2020)
US House, Pennsylvania District 15, 2014, every candidate Candidate Party Votes and share Share RepublicanCharles W DentWon Republican 128,285100.0% - Votes for listed candidates
- 297,724
- Election day
- November 6, 2012
- District map
- Older district map (2012 to 2020)
US House, Pennsylvania District 15, 2012, every candidate Candidate Party Votes and share Share RepublicanCharles W DentWon Republican 168,96056.8% DemocraticRick Daugherty Democratic 128,76443.2% - Votes for listed candidates
- 204,548
- Election day
- November 2, 2010
- District map
- Older district map (2002 to 2010)
US House, Pennsylvania District 15, 2010, every candidate Candidate Party Votes and share Share RepublicanCharles W DentWon Republican 109,53453.5% DemocraticJohn B Callahan Democratic 79,76639.0% OtherJake Towne Other 15,2487.5% - Votes for listed candidates
- 309,766
- Election day
- November 4, 2008
- District map
- Older district map (2002 to 2010)
US House, Pennsylvania District 15, 2008, every candidate Candidate Party Votes and share Share RepublicanCharles W DentWon Republican 181,43358.6% DemocraticSam Bennett Democratic 128,33341.4% - Votes for listed candidates
- 198,173
- Election day
- November 7, 2006
- District map
- Older district map (2002 to 2010)
US House, Pennsylvania District 15, 2006, every candidate Candidate Party Votes and share Share RepublicanCharles W DentWon Republican 106,15353.6% DemocraticCharles Dertinger Democratic 86,18643.5% GreenGreta Browne Green 5,8022.9% Scattered write-insName as filed: Writein Write-in 320.0% - Votes for listed candidates
- 291,134
- Election day
- November 2, 2004
- District map
- Older district map (2002 to 2010)
US House, Pennsylvania District 15, 2004, every candidate Candidate Party Votes and share Share RepublicanCharles W DentWon Republican 170,63458.6% DemocraticJoe Driscoll Democratic 114,64639.4% LibertarianRichard J Piotrowski Libertarian 3,6601.3% GreenGreta Browne Green 2,1940.8% - Votes for listed candidates
- 171,713
- Election day
- November 5, 2002
- District map
- Older district map (2002 to 2010)
US House, Pennsylvania District 15, 2002, every candidate Candidate Party Votes and share Share RepublicanPatrick J ToomeyWon Republican 98,49357.4% DemocraticEdward J O'Brien Democratic 73,21242.6% Scattered write-insName as filed: Writein Write-in 80.0% - Votes for listed candidates
- 222,171
- Election day
- November 7, 2000
- District map
- Older district map (1992 to 2000)
US House, Pennsylvania District 15, 2000, every candidate Candidate Party Votes and share Share RepublicanPatrick J ToomeyWon Republican 118,30753.3% DemocraticEd O'Brien Democratic 103,86446.7% - Votes for listed candidates
- 148,706
- Election day
- November 3, 1998
- District map
- Older district map (1992 to 2000)
US House, Pennsylvania District 15, 1998, every candidate Candidate Party Votes and share Share RepublicanPat ToomeyWon Republican 81,75555.0% DemocraticRoy C Afflerbach Democratic 66,93045.0% Scattered write-insName as filed: Writein Write-in 210.0% - Votes for listed candidates
- 200,363
- Election day
- November 5, 1996
- District map
- Older district map (1992 to 2000)
US House, Pennsylvania District 15, 1996, every candidate Candidate Party Votes and share Share DemocraticPaul McHaleWon Democratic 109,81254.8% RepublicanBob Kilbanks Republican 82,80341.3% OtherNicholas R Sabatine III Other 6,9313.5% OtherPhilip E Faust Other 8120.4% Scattered write-insName as filed: Writein Write-in 50.0% - Votes for listed candidates
- 150,909
- Election day
- November 8, 1994
- District map
- Older district map (1992 to 2000)
US House, Pennsylvania District 15, 1994, every candidate Candidate Party Votes and share Share DemocraticPaul McHaleWon Democratic 72,07347.8% RepublicanJim Yeager Republican 71,60247.4% OtherVictor Mazziotti Other 7,2274.8% Scattered write-insName as filed: Writein Write-in 70.0% - Votes for listed candidates
- 213,324
- Election day
- November 3, 1992
- District map
- Older district map (1992 to 2000)
US House, Pennsylvania District 15, 1992, every candidate Candidate Party Votes and share Share DemocraticPaul McHaleWon Democratic 111,41952.2% RepublicanDon Ritter Republican 99,52046.7% OtherEugene A Nau Other 2,3851.1% - Votes for listed candidates
- 127,411
- Election day
- November 6, 1990
- District map
- Older district map (1982 to 1990)
US House, Pennsylvania District 15, 1990, every candidate Candidate Party Votes and share Share RepublicanDon RitterWon Republican 77,17860.6% DemocraticRichard J Orloski Democratic 50,23339.4% - Votes for listed candidates
- 186,078
- Election day
- November 8, 1988
- District map
- Older district map (1982 to 1990)
US House, Pennsylvania District 15, 1988, every candidate Candidate Party Votes and share Share RepublicanDon RitterWon Republican 106,95157.5% DemocraticEd Reibman Democratic 79,12742.5% - Votes for listed candidates
- 131,801
- Election day
- November 4, 1986
- District map
- Older district map (1982 to 1990)
US House, Pennsylvania District 15, 1986, every candidate Candidate Party Votes and share Share RepublicanDon RitterWon Republican 74,82956.8% DemocraticJoe Simonetta Democratic 56,97243.2% - Votes for listed candidates
- 189,828
- Election day
- November 6, 1984
- District map
- Older district map (1982 to 1990)
US House, Pennsylvania District 15, 1984, every candidate Candidate Party Votes and share Share RepublicanDon RitterWon Republican 110,33858.1% DemocraticJane Wells-Schooley Democratic 79,49041.9% - Votes for listed candidates
- 137,457
- Election day
- November 2, 1982
- District map
- Older district map (1982 to 1990)
US House, Pennsylvania District 15, 1982, every candidate Candidate Party Votes and share Share RepublicanDon RitterWon Republican 79,45557.8% DemocraticRichard J Orloski Democratic 58,00242.2% - Votes for listed candidates
- 167,725
- Election day
- November 4, 1980
- District map
- Older district map (1972 to 1980)
US House, Pennsylvania District 15, 1980, every candidate Candidate Party Votes and share Share RepublicanDon RitterWon Republican 99,87459.5% DemocraticJeanette Reibman Democratic 66,62639.7% LibertarianBarbara Karkutt Libertarian 1,2250.7% - Votes for listed candidates
- 124,063
- Election day
- November 7, 1978
- District map
- Older district map (1972 to 1980)
US House, Pennsylvania District 15, 1978, every candidate Candidate Party Votes and share Share RepublicanDonald Lawrence RitterWon Republican 65,98653.2% DemocraticFred B Rooney Democratic 58,07746.8% - Votes for listed candidates
- 166,890
- Election day
- November 2, 1976
- District map
- Older district map (1972 to 1980)
US House, Pennsylvania District 15, 1976, every candidate Candidate Party Votes and share Share DemocraticFred B RooneyWon Democratic 108,84465.2% RepublicanAlice B Sivulich Republican 57,61634.5% OtherMary Jane Coates Other 4300.3%
1976 to 2024: MIT Election Data and Science Lab, U.S. House 1976-2024, retrieved Oct 28, 2026. Compiled by MIT Election Data and Science Lab (MEDSL) from official returns; not an official source
District numbers are reused after each redistricting, so rows on older lines cover different territory than today's Pennsylvania District 15.
Download and cite
Cite this page
Election Wrld. (2026). Pennsylvania District 15, US House results. https://www.electionwrld.com/pa/congress/15. Retrieved October 31, 2026.
Embed this seat
<iframe src="https://www.electionwrld.com/embed/pa/congress/15" title="Pennsylvania District 15, US House" width="100%" height="400" style="border:0;max-width:640px" loading="lazy"></iframe>
<p style="font-size:13px">Data: <a href="https://www.electionwrld.com">Election Wrld</a>, CC BY 4.0</p>Sources
Sources: MIT Election Data and Science Lab, U.S. House 1976-2024 (CC0 1.0), retrieved Oct 28, 2026, compiled by MIT Election Data and Science Lab (MEDSL) from official returns, not an official source; Census TIGERweb Legislative MapServer (120th CDs layer 0, 119th CDs layer 4, 2026 SLD upper layer 1 and lower layer 2) (US Census Bureau, public domain), retrieved Oct 28, 2026; unitedstates/congress-legislators (current) (CC0-1.0), retrieved Oct 28, 2026, compiled by the @unitedstates project volunteers (rosters from official congressional sources) from official returns, not an official source.
DataState data (JSON)Sources: MIT Election Data and Science Lab, U.S. House 1976-2024, FEC, DIME (ODC-BY), Portraits: unitedstates/images (public domain)Data as of Oct 28, 2026