

Texas District 18
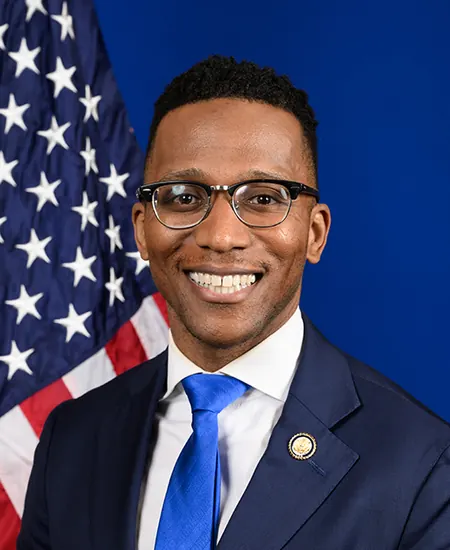
Tue, Nov 3 · Sitting member, elected on the old lines Christian D. Menefee Democratic since Feb 2026
No published poll names both candidates.District lines changed for 2026. Results from the old lines aren't shown.
- Lines for 2026
- Redrawn. 74.2% of residents were in a different district in 2024
- On the 2026 ballot
- 2 candidates
Side by side
Left column: MenefeeRight column: Whitfield
- Total receipts, 2025-2026 cycle, through Oct 14
- $3.8M
- No FEC report
- Cash on hand
- $78K
- No FEC report
- Years since first win
- 0
- Not available
- Age on Election Day
- 38
- Not available
Money: FEC bulk data, through Oct 14. One or more are matched to the FEC by name, party and seat, so a total could belong to someone else.
How these are counted
Total receipts line of each candidate’s principal campaign committee, 2025-2026 cycle. Other sites may show career, six-year or all-committee totals, which differ. Menefee: $3,761,777 received, $77,685 cash on hand.
More about this race
Candidates on the ballot
- Christian D. MenefeeIncumbentDemocratic
- Ronald Dwayne WhitfieldRepublican
Source: sos.state.tx.us (PDF), dated Aug 28
All Texas districts
- D 15+ pts
- D 5 to 15 pts
- D under 5 pts
- R under 5 pts
- R 5 to 15 pts
- R 15+ pts
- Other winner
- No data
Show these districts as a list (38)
- Texas District 1· New lines for 2026, old result not shown
- Texas District 2· New lines for 2026, old result not shown
- Texas District 3· New lines for 2026, old result not shown
- Texas District 4· New lines for 2026, old result not shown
- Texas District 5· New lines for 2026, old result not shown
- Texas District 6· New lines for 2026, old result not shown
- Texas District 7· New lines for 2026, old result not shown
- Texas District 8· New lines for 2026, old result not shown
- Texas District 9· New lines for 2026, old result not shown
- Texas District 10· New lines for 2026, old result not shown
- Texas District 11· New lines for 2026, old result not shown
- Texas District 12· New lines for 2026, old result not shown
- Texas District 13· New lines for 2026, old result not shown
- Texas District 14· New lines for 2026, old result not shown
- Texas District 15· New lines for 2026, old result not shown
- Texas District 16· New lines for 2026, old result not shown
- Texas District 17· New lines for 2026, old result not shown
- Texas District 18· New lines for 2026, old result not shown
- Texas District 19· Jodey C. Arrington (R), Republican by 70.4 points, 2024
- Texas District 20· New lines for 2026, old result not shown
- Texas District 21· New lines for 2026, old result not shown
- Texas District 22· New lines for 2026, old result not shown
- Texas District 23· New lines for 2026, old result not shown
- Texas District 24· New lines for 2026, old result not shown
- Texas District 25· New lines for 2026, old result not shown
- Texas District 26· New lines for 2026, old result not shown
- Texas District 27· New lines for 2026, old result not shown
- Texas District 28· New lines for 2026, old result not shown
- Texas District 29· New lines for 2026, old result not shown
- Texas District 30· New lines for 2026, old result not shown
- Texas District 31· New lines for 2026, old result not shown
- Texas District 32· New lines for 2026, old result not shown
- Texas District 33· New lines for 2026, old result not shown
- Texas District 34· New lines for 2026, old result not shown
- Texas District 35· New lines for 2026, old result not shown
- Texas District 36· New lines for 2026, old result not shown
- Texas District 37· New lines for 2026, old result not shown
- Texas District 38· New lines for 2026, old result not shown
Map settings
Vote in Texas
- Register
- Registration, polling place, sample ballot lookup, election office
- Mail ballot status
- ID rules
Trouble voting? Election Protection hotline: 866-OUR-VOTE. A nonpartisan coalition of civil-rights and voting-rights groups, not a government service. 866ourvote.org
History (25 elections for this seat)
- Votes for listed candidates
- 218,720
- Election day
- November 5, 2024
- District map
- Older district map (2022 to 2025)
US House, Texas District 18, 2024, every candidate Candidate Party Votes and share Share DemocraticSylvester TurnerWon Democratic 151,83469.4% RepublicanLana Centonze Republican 66,81030.5% OtherVince Duncan Other 620.0% OtherKevin Dural Other 140.0% - Votes for listed candidates
- 156,268
- Election day
- November 8, 2022
- District map
- Older district map (2022 to 2025)
US House, Texas District 18, 2022, every candidate Candidate Party Votes and share Share DemocraticSheila Jackson-LeeWon Democratic 110,51170.7% RepublicanCarmen Maria Montiel Republican 40,94126.2% IndependentVince Duncan Independent 2,7661.8% LibertarianPhil Kurtz Libertarian 2,0501.3% - Votes for listed candidates
- 246,895
- Election day
- November 3, 2020
- District map
- Older district map (2012 to 2020)
US House, Texas District 18, 2020, every candidate Candidate Party Votes and share Share DemocraticSheila Jackson-LeeWon Democratic 180,95273.3% RepublicanWendell Champion Republican 58,03323.5% LibertarianLuke Spencer Libertarian 4,5141.8% IndependentVince Duncan Independent 3,3961.4% - Votes for listed candidates
- 184,332
- Election day
- November 6, 2018
- District map
- Older district map (2012 to 2020)
US House, Texas District 18, 2018, every candidate Candidate Party Votes and share Share DemocraticSheila Jackson-LeeWon Democratic 138,70475.2% RepublicanAva Reynero Pate Republican 38,36820.8% LibertarianLuke Spencer Libertarian 4,0672.2% IndependentVince Duncan Independent 3,1931.7% - Votes for listed candidates
- 204,308
- Election day
- November 8, 2016
- District map
- Older district map (2012 to 2020)
US House, Texas District 18, 2016, every candidate Candidate Party Votes and share Share DemocraticSheila Jackson-LeeWon Democratic 150,15773.5% RepublicanLori Bartley Republican 48,30623.6% GreenThomas Kleven Green 5,8452.9% - Votes for listed candidates
- 106,010
- Election day
- November 4, 2014
- District map
- Older district map (2012 to 2020)
US House, Texas District 18, 2014, every candidate Candidate Party Votes and share Share DemocraticSheila Jackson-LeeWon Democratic 76,09771.8% RepublicanSean Seibert Republican 26,24924.8% IndependentVince Duncan Independent 2,3622.2% GreenRemington Alessi Green 1,3021.2% - Votes for listed candidates
- 194,932
- Election day
- November 6, 2012
- District map
- Older district map (2012 to 2020)
US House, Texas District 18, 2012, every candidate Candidate Party Votes and share Share DemocraticSheila Jackson-LeeWon Democratic 146,22375.0% RepublicanSean Seibert Republican 44,01522.6% LibertarianChristopher Barber Libertarian 4,6942.4% - Votes for listed candidates
- 121,321
- Election day
- November 2, 2010
- District map
- Older district map (2002 to 2010)
US House, Texas District 18, 2010, every candidate Candidate Party Votes and share Share DemocraticSheila Jackson-LeeWon Democratic 85,10870.2% RepublicanJohn Faulk Republican 33,06727.3% LibertarianMike Taylor Libertarian 3,1182.6% Scattered write-insName as filed: Writein Write-in 280.0% - Votes for listed candidates
- 192,198
- Election day
- November 4, 2008
- District map
- Older district map (2002 to 2010)
US House, Texas District 18, 2008, every candidate Candidate Party Votes and share Share DemocraticSheila Jackson-LeeWon Democratic 148,61777.3% RepublicanJohn Faulk Republican 39,09520.3% LibertarianMike Taylor Libertarian 4,4862.3% - Votes for listed candidates
- 86,051
- Election day
- November 7, 2006
- District map
- Older district map (2002 to 2010)
US House, Texas District 18, 2006, every candidate Candidate Party Votes and share Share DemocraticSheila Jackson-LeeWon Democratic 65,93676.6% RepublicanAhmad Hassan Republican 16,44819.1% LibertarianPatrick Warren Libertarian 3,6674.3% - Votes for listed candidates
- 152,988
- Election day
- November 2, 2004
- District map
- Older district map (2002 to 2010)
US House, Texas District 18, 2004, every candidate Candidate Party Votes and share Share DemocraticSheila Jackson-LeeWon Democratic 136,01888.9% RepublicanTom Bazan Republican 9,7876.4% LibertarianBrent Sullivan Libertarian 7,1834.7% - Votes for listed candidates
- 128,926
- Election day
- November 5, 2002
- District map
- Older district map (2002 to 2010)
US House, Texas District 18, 2002, every candidate Candidate Party Votes and share Share DemocraticSheila Jackson-LeeWon Democratic 99,16176.9% RepublicanPhillip J Abbott Republican 27,98021.7% LibertarianBrent Sullivan Libertarian 1,7851.4% - Votes for listed candidates
- 172,378
- Election day
- November 7, 2000
- District map
- Older district map (1992 to 2000)
US House, Texas District 18, 2000, every candidate Candidate Party Votes and share Share DemocraticSheila Jackson-LeeWon Democratic 131,85776.5% RepublicanBob Levy Republican 38,19122.2% LibertarianColin Nankervis Libertarian 2,3301.4% - Votes for listed candidates
- 91,267
- Election day
- November 3, 1998
- District map
- Older district map (1992 to 2000)
US House, Texas District 18, 1998, every candidate Candidate Party Votes and share Share DemocraticSheila Jackson-LeeWon Democratic 82,09189.9% LibertarianJames Galvan Libertarian 9,17610.1% - Votes for listed candidates
- 137,688
- Election day
- not on file
- Type
- Special election
- District map
- Older district map (1992 to 2000)
US House, Texas District 18, 1996, every candidate Candidate Party Votes and share Share DemocraticSheila Jackson-LeeWon Democratic 106,11177.1% RepublicanLarry White Republican 13,95610.1% RepublicanJerry Burley Republican 7,8775.7% RepublicanGeorge A Young Republican 5,3323.9% DemocraticMike Lamson Democratic 4,4123.2% - Votes for listed candidates
- 115,390
- Election day
- November 8, 1994
- District map
- Older district map (1992 to 2000)
US House, Texas District 18, 1994, every candidate Candidate Party Votes and share Share DemocraticSheila Jackson-LeeWon Democratic 84,79073.5% RepublicanJerry Burley Republican 28,15324.4% IndependentJ Larry Snellings Independent 1,2781.1% LibertarianGeorge M Hollenbeck Libertarian 1,1691.0% - Votes for listed candidates
- 172,208
- Election day
- November 3, 1992
- District map
- Older district map (1992 to 2000)
US House, Texas District 18, 1992, every candidate Candidate Party Votes and share Share DemocraticCraig A WashingtonWon Democratic 111,42264.7% RepublicanEdward Blum Republican 56,08032.6% LibertarianGregg Lassen Libertarian 4,7062.7% - Votes for listed candidates
- 54,720
- Election day
- November 6, 1990
- District map
- Older district map (1982 to 1990)
US House, Texas District 18, 1990, every candidate Candidate Party Votes and share Share DemocraticCraig A WashingtonWon Democratic 54,47799.6% Scattered write-insName as filed: Writein Write-in 2430.4% - Votes for listed candidates
- 101,643
- Election day
- November 8, 1988
- District map
- Older district map (1982 to 1990)
US House, Texas District 18, 1988, every candidate Candidate Party Votes and share Share DemocraticMickey LelandWon Democratic 94,40892.9% LibertarianJ Alejandro Snead Libertarian 7,2357.1% - Votes for listed candidates
- 70,219
- Election day
- November 4, 1986
- District map
- Older district map (1982 to 1990)
US House, Texas District 18, 1986, every candidate Candidate Party Votes and share Share DemocraticMickey LelandWon Democratic 63,33590.2% IndependentJoanne Kuniansky Independent 6,8849.8% - Votes for listed candidates
- 139,110
- Election day
- November 6, 1984
- District map
- Older district map (1982 to 1990)
US House, Texas District 18, 1984, every candidate Candidate Party Votes and share Share DemocraticMickey LelandWon Democratic 109,62678.8% RepublicanGlen E Beaman Republican 26,40019.0% IndependentJose Alvardo Independent 3,0642.2% OtherOther Other 200.0% - Votes for listed candidates
- 82,335
- Election day
- November 2, 1982
- District map
- Older district map (1982 to 1990)
US House, Texas District 18, 1982, every candidate Candidate Party Votes and share Share DemocraticMickey LelandWon Democratic 68,01482.6% RepublicanC Leon Pickett Republican 12,10414.7% LibertarianThomas P Bernhardt Libertarian 2,2152.7% Scattered write-insName as filed: Writein Write-in 20.0% - Votes for listed candidates
- 90,096
- Election day
- November 4, 1980
- District map
- Older district map (1972 to 1980)
US House, Texas District 18, 1980, every candidate Candidate Party Votes and share Share DemocraticMickey LelandWon Democratic 71,98579.9% RepublicanCl Kennedy Republican 16,12817.9% LibertarianBill Fraser Libertarian 1,9832.2% - Votes for listed candidates
- 38,018
- Election day
- November 7, 1978
- District map
- Older district map (1972 to 1980)
US House, Texas District 18, 1978, every candidate Candidate Party Votes and share Share DemocraticGoerge Thomas "Mickey" LelandWon Democratic 36,78396.8% OtherDeborah Vee Vernier Other 1,2353.2% - Votes for listed candidates
- 109,876
- Election day
- November 2, 1976
- District map
- Older district map (1972 to 1980)
US House, Texas District 18, 1976, every candidate Candidate Party Votes and share Share DemocraticBarbara JordanWon Democratic 93,95385.5% RepublicanSam H Wright Republican 15,38114.0% OtherSylvia Zapata Other 5420.5%
1976 to 2024: MIT Election Data and Science Lab, U.S. House 1976-2024, retrieved Oct 28, 2026. Compiled by MIT Election Data and Science Lab (MEDSL) from official returns; not an official source
Texas District 18 was redrawn for 2026, so every row here ran on older lines and covers different territory. The map in force, by state
Download and cite
Cite this page
Election Wrld. (2026). Texas District 18, US House results. https://www.electionwrld.com/tx/congress/18. Retrieved October 30, 2026.
Embed this seat
<iframe src="https://www.electionwrld.com/embed/tx/congress/18" title="Texas District 18, US House" width="100%" height="400" style="border:0;max-width:640px" loading="lazy"></iframe>
<p style="font-size:13px">Data: <a href="https://www.electionwrld.com">Election Wrld</a>, CC BY 4.0</p>Sources
Sources: MIT Election Data and Science Lab, U.S. House 1976-2024 (CC0 1.0), retrieved Oct 28, 2026, compiled by MIT Election Data and Science Lab (MEDSL) from official returns, not an official source; Census TIGERweb Legislative MapServer (120th CDs layer 0, 119th CDs layer 4, 2026 SLD upper layer 1 and lower layer 2) (US Census Bureau, public domain), retrieved Oct 28, 2026; unitedstates/congress-legislators (current) (CC0-1.0), retrieved Oct 28, 2026, compiled by the @unitedstates project volunteers (rosters from official congressional sources) from official returns, not an official source.
DataState data (JSON)Sources: MIT Election Data and Science Lab, U.S. House 1976-2024, FEC, Photo creditsData as of Oct 28, 2026