

Texas District 4
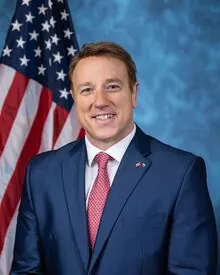
Tue, Nov 3 · Sitting member, elected on the old lines Pat Fallon Republican since Jan 2021
No published poll names both candidates.District lines changed for 2026. Results from the old lines aren't shown.
- Lines for 2026
- Redrawn. 30.7% of residents were in a different district in 2024
- On the 2026 ballot
- 2 candidates
Side by side
Left column: FallonRight column: Pearce
- Total receipts, 2025-2026 cycle, through Oct 14
- $1.0M
- $28K
- Cash on hand
- $1.1M
- $3K
- Donor-based spectrum
- LiberalCentristConservativeFallonNo published score for Pearce
- Races
- Won 3 of 3
- None listed
- Years since first win
- 5
- Not available
- Age on Election Day
- 58
- Not available
Money: FEC bulk data, through Oct 14. One or more are matched to the FEC by name, party and seat, so a total could belong to someone else.
How these are counted
Total receipts line of each candidate’s principal campaign committee, 2025-2026 cycle. Other sites may show career, six-year or all-committee totals, which differ. Fallon: $1,024,466 received, $1,099,395 cash on hand. Pearce: $27,749 received, $2,712 cash on hand. The spectrum is a published research score, not our rating. How this works. Wins and losses count the races in our results files, the same as each profile.
More about this race
Candidates on the ballot
- Jason PearceDemocratic
- Pat FallonIncumbentRepublican
Source: sos.state.tx.us (PDF), dated Aug 28
All Texas districts
- D 15+ pts
- D 5 to 15 pts
- D under 5 pts
- R under 5 pts
- R 5 to 15 pts
- R 15+ pts
- Other winner
- No data
Show these districts as a list (38)
- Texas District 1· New lines for 2026, old result not shown
- Texas District 2· New lines for 2026, old result not shown
- Texas District 3· New lines for 2026, old result not shown
- Texas District 4· New lines for 2026, old result not shown
- Texas District 5· New lines for 2026, old result not shown
- Texas District 6· New lines for 2026, old result not shown
- Texas District 7· New lines for 2026, old result not shown
- Texas District 8· New lines for 2026, old result not shown
- Texas District 9· New lines for 2026, old result not shown
- Texas District 10· New lines for 2026, old result not shown
- Texas District 11· New lines for 2026, old result not shown
- Texas District 12· New lines for 2026, old result not shown
- Texas District 13· New lines for 2026, old result not shown
- Texas District 14· New lines for 2026, old result not shown
- Texas District 15· New lines for 2026, old result not shown
- Texas District 16· New lines for 2026, old result not shown
- Texas District 17· New lines for 2026, old result not shown
- Texas District 18· New lines for 2026, old result not shown
- Texas District 19· Jodey C. Arrington (R), Republican by 70.4 points, 2024
- Texas District 20· New lines for 2026, old result not shown
- Texas District 21· New lines for 2026, old result not shown
- Texas District 22· New lines for 2026, old result not shown
- Texas District 23· New lines for 2026, old result not shown
- Texas District 24· New lines for 2026, old result not shown
- Texas District 25· New lines for 2026, old result not shown
- Texas District 26· New lines for 2026, old result not shown
- Texas District 27· New lines for 2026, old result not shown
- Texas District 28· New lines for 2026, old result not shown
- Texas District 29· New lines for 2026, old result not shown
- Texas District 30· New lines for 2026, old result not shown
- Texas District 31· New lines for 2026, old result not shown
- Texas District 32· New lines for 2026, old result not shown
- Texas District 33· New lines for 2026, old result not shown
- Texas District 34· New lines for 2026, old result not shown
- Texas District 35· New lines for 2026, old result not shown
- Texas District 36· New lines for 2026, old result not shown
- Texas District 37· New lines for 2026, old result not shown
- Texas District 38· New lines for 2026, old result not shown
Map settings
Vote in Texas
- Register
- Registration, polling place, sample ballot lookup, election office
- Mail ballot status
- ID rules
Trouble voting? Election Protection hotline: 866-OUR-VOTE. A nonpartisan coalition of civil-rights and voting-rights groups, not a government service. 866ourvote.org
History (25 elections for this seat)
- Votes for listed candidates
- 353,299
- Election day
- November 5, 2024
- District map
- Older district map (2022 to 2025)
US House, Texas District 4, 2024, every candidate Candidate Party Votes and share Share RepublicanPat FallonWon Republican 241,60368.4% DemocraticSimon Cardell Democratic 111,69631.6% - Votes for listed candidates
- 256,009
- Election day
- November 8, 2022
- District map
- Older district map (2022 to 2025)
US House, Texas District 4, 2022, every candidate Candidate Party Votes and share Share RepublicanPat FallonWon Republican 170,78166.7% DemocraticIro Omere Democratic 79,17930.9% LibertarianJohn Simmons Libertarian 6,0492.4% - Votes for listed candidates
- 337,803
- Election day
- November 3, 2020
- District map
- Older district map (2012 to 2020)
US House, Texas District 4, 2020, every candidate Candidate Party Votes and share Share RepublicanPat FallonWon Republican 253,83775.1% DemocraticRussell Foster Democratic 76,32622.6% LibertarianLou Antonelli Libertarian 6,3341.9% Tracy Jones Write-in 1,3060.4% - Votes for listed candidates
- 249,245
- Election day
- November 6, 2018
- District map
- Older district map (2012 to 2020)
US House, Texas District 4, 2018, every candidate Candidate Party Votes and share Share RepublicanJohn RatcliffeWon Republican 188,66775.7% DemocraticCatherine Krantz Democratic 57,40023.0% LibertarianKen Ashby Libertarian 3,1781.3% - Votes for listed candidates
- 246,220
- Election day
- November 8, 2016
- District map
- Older district map (2012 to 2020)
US House, Texas District 4, 2016, every candidate Candidate Party Votes and share Share RepublicanJohn RatcliffeWon Republican 216,64388.0% LibertarianCody Wommack Libertarian 29,57712.0% - Votes for listed candidates
- 115,085
- Election day
- November 4, 2014
- District map
- Older district map (2012 to 2020)
US House, Texas District 4, 2014, every candidate Candidate Party Votes and share Share RepublicanJohn RatcliffeWon Republican 115,085100.0% - Votes for listed candidates
- 250,343
- Election day
- November 6, 2012
- District map
- Older district map (2012 to 2020)
US House, Texas District 4, 2012, every candidate Candidate Party Votes and share Share RepublicanRalph M HallWon Republican 182,67973.0% DemocraticValinda Hathcox Democratic 60,21424.1% LibertarianThomas Griffing Libertarian 7,2622.9% OtherFred Rostek Other 1880.1% - Votes for listed candidates
- 186,286
- Election day
- November 2, 2010
- District map
- Older district map (2002 to 2010)
US House, Texas District 4, 2010, every candidate Candidate Party Votes and share Share RepublicanRalph M HallWon Republican 136,33873.2% DemocraticValinda Hathcox Democratic 40,97522.0% LibertarianJim D Prindle Libertarian 4,7292.5% IndependentShane Shepard Independent 4,2442.3% - Votes for listed candidates
- 300,744
- Election day
- November 4, 2008
- District map
- Older district map (2002 to 2010)
US House, Texas District 4, 2008, every candidate Candidate Party Votes and share Share RepublicanRalph M HallWon Republican 206,90668.8% DemocraticGlenn Melancon Democratic 88,06729.3% LibertarianFred Annett Libertarian 5,7711.9% - Votes for listed candidates
- 165,269
- Election day
- November 7, 2006
- District map
- Older district map (2002 to 2010)
US House, Texas District 4, 2006, every candidate Candidate Party Votes and share Share RepublicanRalph M HallWon Republican 106,49564.4% DemocraticGlenn Melancon Democratic 55,27833.4% LibertarianKurt G Helm Libertarian 3,4962.1% - Votes for listed candidates
- 267,942
- Election day
- November 2, 2004
- District map
- Older district map (2002 to 2010)
US House, Texas District 4, 2004, every candidate Candidate Party Votes and share Share RepublicanRalph M HallWon Republican 182,86668.2% DemocraticJim Nickerson Democratic 81,58530.4% LibertarianKevin D Anderson Libertarian 3,4911.3% - Votes for listed candidates
- 168,285
- Election day
- November 5, 2002
- District map
- Older district map (2002 to 2010)
US House, Texas District 4, 2002, every candidate Candidate Party Votes and share Share DemocraticRalph M HallWon Democratic 97,30457.8% RepublicanJohn Graves Republican 67,93940.4% LibertarianBarbara Robinson Libertarian 3,0421.8% - Votes for listed candidates
- 241,878
- Election day
- November 7, 2000
- District map
- Older district map (1992 to 2000)
US House, Texas District 4, 2000, every candidate Candidate Party Votes and share Share DemocraticRalph M HallWon Democratic 145,88760.3% RepublicanJon Newton Republican 91,57437.9% LibertarianJoe Turner Libertarian 4,4171.8% - Votes for listed candidates
- 144,080
- Election day
- November 3, 1998
- District map
- Older district map (1992 to 2000)
US House, Texas District 4, 1998, every candidate Candidate Party Votes and share Share DemocraticRalph M HallWon Democratic 82,98957.6% RepublicanJim Lohmeyer Republican 58,95440.9% LibertarianJim Simon Libertarian 2,1371.5% - Votes for listed candidates
- 207,177
- Election day
- November 5, 1996
- District map
- Older district map (1992 to 2000)
US House, Texas District 4, 1996, every candidate Candidate Party Votes and share Share DemocraticRalph M HallWon Democratic 132,12663.8% RepublicanJerry Ray Hall Republican 71,06534.3% LibertarianSteve Rothacker Libertarian 3,1721.5% OtherEnos M Denham Jr Other 8140.4% - Votes for listed candidates
- 168,947
- Election day
- November 8, 1994
- District map
- Older district map (1992 to 2000)
US House, Texas District 4, 1994, every candidate Candidate Party Votes and share Share DemocraticRalph M HallWon Democratic 99,30358.8% RepublicanDavid L Bridges Republican 67,26739.8% LibertarianSteven Rothacker Libertarian 2,3771.4% - Votes for listed candidates
- 220,333
- Election day
- November 3, 1992
- District map
- Older district map (1992 to 2000)
US House, Texas District 4, 1992, every candidate Candidate Party Votes and share Share DemocraticRalph M HallWon Democratic 128,00858.1% RepublicanDavid L Bridges Republican 83,87538.1% LibertarianSteven Rothacker Libertarian 8,4503.8% - Votes for listed candidates
- 108,694
- Election day
- November 6, 1990
- District map
- Older district map (1982 to 1990)
US House, Texas District 4, 1990, every candidate Candidate Party Votes and share Share DemocraticRalph M HallWon Democratic 108,30099.6% Scattered write-insName as filed: Writein Write-in 3940.4% - Votes for listed candidates
- 209,868
- Election day
- November 8, 1988
- District map
- Older district map (1982 to 1990)
US House, Texas District 4, 1988, every candidate Candidate Party Votes and share Share DemocraticRalph M HallWon Democratic 139,37966.4% RepublicanRandy Sutton Republican 67,33732.1% LibertarianMelanie A Dunn Libertarian 3,1521.5% - Votes for listed candidates
- 136,118
- Election day
- November 4, 1986
- District map
- Older district map (1982 to 1990)
US House, Texas District 4, 1986, every candidate Candidate Party Votes and share Share DemocraticRalph M HallWon Democratic 97,54071.7% RepublicanThomas Blow Republican 38,57828.3% - Votes for listed candidates
- 208,341
- Election day
- November 6, 1984
- District map
- Older district map (1982 to 1990)
US House, Texas District 4, 1984, every candidate Candidate Party Votes and share Share DemocraticRalph M HallWon Democratic 120,74958.0% RepublicanThomas Blow Republican 87,55342.0% OtherOther Other 390.0% - Votes for listed candidates
- 127,496
- Election day
- November 2, 1982
- District map
- Older district map (1982 to 1990)
US House, Texas District 4, 1982, every candidate Candidate Party Votes and share Share DemocraticRalph M HallWon Democratic 94,13473.8% RepublicanPete Collumb Republican 32,22125.3% LibertarianBruce Iiams Libertarian 1,1410.9% - Votes for listed candidates
- 196,702
- Election day
- November 4, 1980
- District map
- Older district map (1972 to 1980)
US House, Texas District 4, 1980, every candidate Candidate Party Votes and share Share DemocraticRalph M HallWon Democratic 102,78752.3% RepublicanJohn Wright Republican 93,91547.7% - Votes for listed candidates
- 94,918
- Election day
- November 7, 1978
- District map
- Older district map (1972 to 1980)
US House, Texas District 4, 1978, every candidate Candidate Party Votes and share Share DemocraticRay RobertsWon Democratic 58,33661.5% RepublicanFrank S Glenn Republican 36,58238.5% - Votes for listed candidates
- 168,035
- Election day
- November 2, 1976
- District map
- Older district map (1972 to 1980)
US House, Texas District 4, 1976, every candidate Candidate Party Votes and share Share DemocraticRay RobertsWon Democratic 105,39462.7% RepublicanFrank S Glenn Republican 62,64137.3%
1976 to 2024: MIT Election Data and Science Lab, U.S. House 1976-2024, retrieved Oct 28, 2026. Compiled by MIT Election Data and Science Lab (MEDSL) from official returns; not an official source
Texas District 4 was redrawn for 2026, so every row here ran on older lines and covers different territory. The map in force, by state
Download and cite
Cite this page
Election Wrld. (2026). Texas District 4, US House results. https://www.electionwrld.com/tx/congress/4. Retrieved October 30, 2026.
Embed this seat
<iframe src="https://www.electionwrld.com/embed/tx/congress/4" title="Texas District 4, US House" width="100%" height="400" style="border:0;max-width:640px" loading="lazy"></iframe>
<p style="font-size:13px">Data: <a href="https://www.electionwrld.com">Election Wrld</a>, CC BY 4.0</p>Sources
Sources: MIT Election Data and Science Lab, U.S. House 1976-2024 (CC0 1.0), retrieved Oct 28, 2026, compiled by MIT Election Data and Science Lab (MEDSL) from official returns, not an official source; Census TIGERweb Legislative MapServer (120th CDs layer 0, 119th CDs layer 4, 2026 SLD upper layer 1 and lower layer 2) (US Census Bureau, public domain), retrieved Oct 28, 2026; unitedstates/congress-legislators (current) (CC0-1.0), retrieved Oct 28, 2026, compiled by the @unitedstates project volunteers (rosters from official congressional sources) from official returns, not an official source.
DataState data (JSON)Sources: MIT Election Data and Science Lab, U.S. House 1976-2024, FEC, DIME (ODC-BY), Portraits: unitedstates/images (public domain)Data as of Oct 28, 2026