

Texas District 29
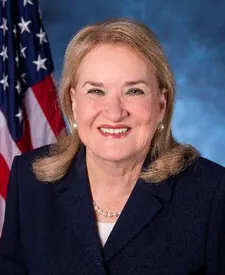
Tue, Nov 3 · Sitting member, elected on the old lines Sylvia R. Garcia Democratic since Jan 2019
No published poll names both candidates.District lines changed for 2026. Results from the old lines aren't shown.
- Lines for 2026
- Redrawn. 62.8% of residents were in a different district in 2024
- On the 2026 ballot
- 2 candidates
Side by side
Left column: FierroRight column: Garcia
- Total receipts, 2025-2026 cycle, through Oct 14
- $585
- $1.2M
- Cash on hand
- $492
- $236K
- Donor-based spectrum
- LiberalCentristConservativeGarciaNo published score for Fierro
- Races won and lost
- None on file
- 5-1
- Years since first win on file
- Not available
- 7
- Age on Election Day
- Not available
- 76
Money: FEC bulk data, through Oct 14. One or more are matched to the FEC by name, party and seat, so a total could belong to someone else.
How these are counted
Total receipts line of each candidate’s principal campaign committee, 2025-2026 cycle. Other sites may show career, six-year or all-committee totals, which differ. Fierro: $585 received, $492 cash on hand. Garcia: $1,201,322 received, $235,764 cash on hand. The spectrum is a published research score, not our rating. How this works. Wins and losses count the races in our results files, the same as each profile.
More about this race
Candidates on the ballot
- Sylvia R. GarciaIncumbentDemocratic
- Martha FierroRepublican
Source: sos.state.tx.us (PDF), dated Aug 28
All Texas districts
- D 15+ pts
- D 5 to 15 pts
- D under 5 pts
- R under 5 pts
- R 5 to 15 pts
- R 15+ pts
- Other winner
- No data
Show these districts as a list (38)
- Texas District 1· New lines for 2026, old result not shown
- Texas District 2· New lines for 2026, old result not shown
- Texas District 3· New lines for 2026, old result not shown
- Texas District 4· New lines for 2026, old result not shown
- Texas District 5· New lines for 2026, old result not shown
- Texas District 6· New lines for 2026, old result not shown
- Texas District 7· New lines for 2026, old result not shown
- Texas District 8· New lines for 2026, old result not shown
- Texas District 9· New lines for 2026, old result not shown
- Texas District 10· New lines for 2026, old result not shown
- Texas District 11· New lines for 2026, old result not shown
- Texas District 12· New lines for 2026, old result not shown
- Texas District 13· New lines for 2026, old result not shown
- Texas District 14· New lines for 2026, old result not shown
- Texas District 15· New lines for 2026, old result not shown
- Texas District 16· New lines for 2026, old result not shown
- Texas District 17· New lines for 2026, old result not shown
- Texas District 18· New lines for 2026, old result not shown
- Texas District 19· Jodey C. Arrington (R), Republican by 70.4 points, 2024
- Texas District 20· New lines for 2026, old result not shown
- Texas District 21· New lines for 2026, old result not shown
- Texas District 22· New lines for 2026, old result not shown
- Texas District 23· New lines for 2026, old result not shown
- Texas District 24· New lines for 2026, old result not shown
- Texas District 25· New lines for 2026, old result not shown
- Texas District 26· New lines for 2026, old result not shown
- Texas District 27· New lines for 2026, old result not shown
- Texas District 28· New lines for 2026, old result not shown
- Texas District 29· New lines for 2026, old result not shown
- Texas District 30· New lines for 2026, old result not shown
- Texas District 31· New lines for 2026, old result not shown
- Texas District 32· New lines for 2026, old result not shown
- Texas District 33· New lines for 2026, old result not shown
- Texas District 34· New lines for 2026, old result not shown
- Texas District 35· New lines for 2026, old result not shown
- Texas District 36· New lines for 2026, old result not shown
- Texas District 37· New lines for 2026, old result not shown
- Texas District 38· New lines for 2026, old result not shown
Map settings
Vote in Texas
- Register
- Registration, polling place, sample ballot lookup, election office
- Mail ballot status
- ID rules
Trouble voting? Election Protection hotline: 866-OUR-VOTE. A nonpartisan coalition of civil-rights and voting-rights groups, not a government service. 866ourvote.org
History (17 elections for this seat)
- Votes for listed candidates
- 152,209
- Election day
- November 5, 2024
- District map
- Older district map (2022 to 2025)
US House, Texas District 29, 2024, every candidate Candidate Party Votes and share Share DemocraticSylvia R. GarciaWon Democratic 99,37965.3% RepublicanAlan Garza Republican 52,83034.7% - Votes for listed candidates
- 100,602
- Election day
- November 8, 2022
- District map
- Older district map (2022 to 2025)
US House, Texas District 29, 2022, every candidate Candidate Party Votes and share Share DemocraticSylvia R. GarciaWon Democratic 71,83771.4% RepublicanRobert Schafranek Republican 28,76528.6% - Votes for listed candidates
- 156,473
- Election day
- November 3, 2020
- District map
- Older district map (2012 to 2020)
US House, Texas District 29, 2020, every candidate Candidate Party Votes and share Share DemocraticSylvia R. GarciaWon Democratic 111,30571.1% RepublicanJaimy Z Blanco Republican 42,84027.4% LibertarianPhil Kurtz Libertarian 2,3281.5% - Votes for listed candidates
- 117,494
- Election day
- November 6, 2018
- District map
- Older district map (2012 to 2020)
US House, Texas District 29, 2018, every candidate Candidate Party Votes and share Share DemocraticSylvia R. GarciaWon Democratic 88,18875.1% RepublicanPhillip Aronoff Republican 28,09823.9% LibertarianCullen Burns Libertarian 1,1991.0% Scattered write-insName as filed: Writein Write-in 90.0% - Votes for listed candidates
- 131,982
- Election day
- November 8, 2016
- District map
- Older district map (2012 to 2020)
US House, Texas District 29, 2016, every candidate Candidate Party Votes and share Share DemocraticGene GreenWon Democratic 95,64972.5% RepublicanJulio Garza Republican 31,64624.0% LibertarianN Ruben Perez Libertarian 3,2342.5% GreenJames Partsch-Galvan Green 1,4531.1% - Votes for listed candidates
- 46,143
- Election day
- November 4, 2014
- District map
- Older district map (2012 to 2020)
US House, Texas District 29, 2014, every candidate Candidate Party Votes and share Share DemocraticGene GreenWon Democratic 41,32189.5% LibertarianJames Stanczak Libertarian 4,82210.5% - Votes for listed candidates
- 95,611
- Election day
- November 6, 2012
- District map
- Older district map (2012 to 2020)
US House, Texas District 29, 2012, every candidate Candidate Party Votes and share Share DemocraticGene GreenWon Democratic 86,05390.0% LibertarianJames Stanczak Libertarian 4,9965.2% GreenMaria Selva Green 4,5624.8% - Votes for listed candidates
- 66,948
- Election day
- November 2, 2010
- District map
- Older district map (2002 to 2010)
US House, Texas District 29, 2010, every candidate Candidate Party Votes and share Share DemocraticGene GreenWon Democratic 43,25764.6% RepublicanRoy Morales Republican 22,82534.1% LibertarianBrad Walters Libertarian 8661.3% - Votes for listed candidates
- 106,794
- Election day
- November 4, 2008
- District map
- Older district map (2002 to 2010)
US House, Texas District 29, 2008, every candidate Candidate Party Votes and share Share DemocraticGene GreenWon Democratic 79,71874.6% RepublicanEric Story Republican 25,51223.9% LibertarianJoel Grace Libertarian 1,5641.5% - Votes for listed candidates
- 50,550
- Election day
- November 7, 2006
- District map
- Older district map (2002 to 2010)
US House, Texas District 29, 2006, every candidate Candidate Party Votes and share Share DemocraticGene GreenWon Democratic 37,17473.5% RepublicanEric Story Republican 12,34724.4% LibertarianClifford Lee Messina Libertarian 1,0292.0% - Votes for listed candidates
- 83,124
- Election day
- November 2, 2004
- District map
- Older district map (2002 to 2010)
US House, Texas District 29, 2004, every candidate Candidate Party Votes and share Share DemocraticGene GreenWon Democratic 78,25694.1% LibertarianClifford Messina Libertarian 4,8685.9% - Votes for listed candidates
- 58,593
- Election day
- November 5, 2002
- District map
- Older district map (2002 to 2010)
US House, Texas District 29, 2002, every candidate Candidate Party Votes and share Share DemocraticGene GreenWon Democratic 55,76095.2% LibertarianPaul Hansen Libertarian 2,8334.8% - Votes for listed candidates
- 115,475
- Election day
- November 7, 2000
- District map
- Older district map (1992 to 2000)
US House, Texas District 29, 2000, every candidate Candidate Party Votes and share Share DemocraticGene GreenWon Democratic 84,66573.3% RepublicanJoe Vu Republican 29,60625.6% LibertarianRay Dittmar Libertarian 1,2041.0% - Votes for listed candidates
- 47,631
- Election day
- November 3, 1998
- District map
- Older district map (1992 to 2000)
US House, Texas District 29, 1998, every candidate Candidate Party Votes and share Share DemocraticGene GreenWon Democratic 44,17992.8% IndependentLea Sherman Independent 2,0134.2% LibertarianJames P Chudleigh Libertarian 1,4393.0% - Votes for listed candidates
- 91,472
- Election day
- not on file
- Type
- Special election
- District map
- Older district map (1992 to 2000)
US House, Texas District 29, 1996, every candidate Candidate Party Votes and share Share DemocraticGene GreenWon Democratic 61,75167.5% RepublicanJack Rodriguez Republican 28,38131.0% OtherJack W Klinger Other 1,3401.5% - Votes for listed candidates
- 60,054
- Election day
- November 8, 1994
- District map
- Older district map (1992 to 2000)
US House, Texas District 29, 1994, every candidate Candidate Party Votes and share Share DemocraticGene GreenWon Democratic 44,10273.4% RepublicanHarold "Oilman" Eide Republican 15,95226.6% - Votes for listed candidates
- 98,673
- Election day
- November 3, 1992
- District map
- Older district map (1992 to 2000)
US House, Texas District 29, 1992, every candidate Candidate Party Votes and share Share DemocraticGene GreenWon Democratic 64,06464.9% RepublicanClark Kent Ervin Republican 34,60935.1%
1992 to 2024: MIT Election Data and Science Lab, U.S. House 1976-2024, retrieved Oct 28, 2026. Compiled by MIT Election Data and Science Lab (MEDSL) from official returns; not an official source
Texas District 29 was redrawn for 2026, so every row here ran on older lines and covers different territory. The map in force, by state
Download and cite
Cite this page
Election Wrld. (2026). Texas District 29, US House results. https://www.electionwrld.com/tx/congress/29. Retrieved October 30, 2026.
Embed this seat
<iframe src="https://www.electionwrld.com/embed/tx/congress/29" title="Texas District 29, US House" width="100%" height="400" style="border:0;max-width:640px" loading="lazy"></iframe>
<p style="font-size:13px">Data: <a href="https://www.electionwrld.com">Election Wrld</a>, CC BY 4.0</p>Sources
Sources: MIT Election Data and Science Lab, U.S. House 1976-2024 (CC0 1.0), retrieved Oct 28, 2026, compiled by MIT Election Data and Science Lab (MEDSL) from official returns, not an official source; Census TIGERweb Legislative MapServer (120th CDs layer 0, 119th CDs layer 4, 2026 SLD upper layer 1 and lower layer 2) (US Census Bureau, public domain), retrieved Oct 28, 2026; unitedstates/congress-legislators (current) (CC0-1.0), retrieved Oct 28, 2026, compiled by the @unitedstates project volunteers (rosters from official congressional sources) from official returns, not an official source.
DataState data (JSON)Sources: MIT Election Data and Science Lab, U.S. House 1976-2024, FEC, DIME (ODC-BY), Portraits: unitedstates/images (public domain)Data as of Oct 28, 2026